The content in this space is currently being migrated to the cloud. Any content edits must be made by a Knowledge Base admin until migration is complete.
To request content edits, please submit a request to the Strategic Operations Training Team![]() and include the page URL and details on required edits.
and include the page URL and details on required edits.
A member of the Strategic Operations Training Team will reach out for clarity if needed.
Tableau: Self-Service Workspace Area
File
Provides access to Save, Save As, Revert, or Close an open worksheet. Revert is only selectable when changes are made to a worksheet.
Worksheet
Provides access to worksheet based controls both during dashboard creation and when viewing published dashboards in Tableau. Refer to the table below for specific details.
Dashboard
Provides access to Add new Dashboards . Additionally, you can Add existing worksheets or new worksheets to the current dashboard.
Analysis
Provides access to add or edit Calculated Fields.
Map
Allows the ability to choose between Background Maps.
Format
Provides access to Edit a workbook, Clear worksheet formatting, or Adjust format animations.
Help
Provides access to Tableaus online help and support resources.
Tableau Desktop Application
Hide Side Bar
Click the collapse arrow in the side bar.
Show Side Bar
Click the expand arrow in the bottom-left of the workspace (on the status bar).
Tableau Cloud Application
Hide Side Bar
Click the collapse arrow in the side bar.
Show Side Bar
Click the expand arrow in the side bar.
For example, the status in the example screenshot below shows that the view has 143 marks shown in 3 rows and 12 columns. It also shows that the SUM(Sales) for all the marks in the view is $2,297,201 .
Measures
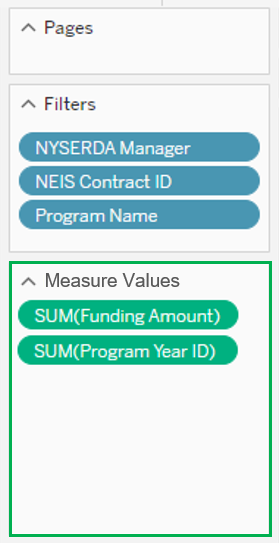
Measures are numeric, quantifiable fields you can use in your data to get aggregated values of the data. When you drag a measure into the view, Tableau applies an aggregation to that measure (by default).
Dimensions
Dimensions contain qualitative values (such as names, dates, or geographical data). You can use dimensions to categorize, segment, and reveal the details in your data. Dimensions affect the level of detail in the view.
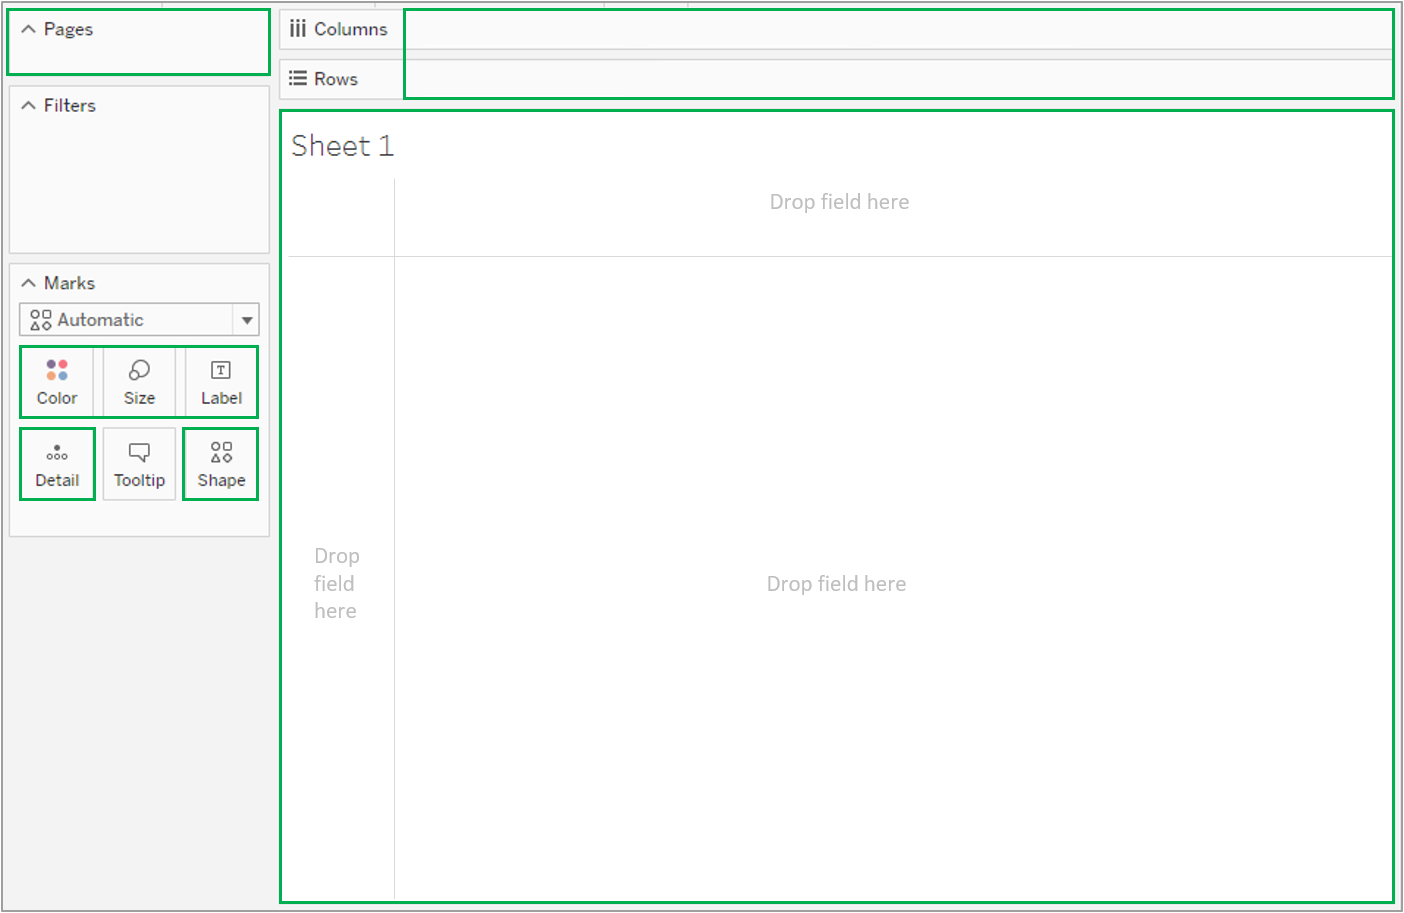
Adding a Dimension to any of the following locations in Tableau affects the level of detail:
FAQ
Data
The Data Tab allows users to implement fields with calculations specific to the source worksheet. Any data types within the Data Tab can be dragged and dropped into the sheet to create columns or rows for analysis.
Analytics
The Analytics Tab provides tools to summarize and model visualizations of the data in the worksheet. You can create different trend-lines and plots after dragging and dropping data types into the sheet. The Analytics functions can only be used on numerical data types.
Access the Knowledge Base home page.
In the introductory description of the Knowledge Base, click on the hyperlink that allows you to submit a request to the Strategic Operations Training Team.
Fill out the subsequent form. The Subject of the request should be Additional Tableau Training. At the end of the form, include the specific areas of Tableau you would like more training on.
Submit the form, and a member of the Strategic Operations Training Team will reach out to you shortly with details on further training.


