Important Notice
The content in this space is currently being migrated to the cloud. Any content edits must be made by a Knowledge Base admin until migration is complete.
To request content edits, please submit a request to the Strategic Operations Training Team![]() and include the page URL and details on required edits.
and include the page URL and details on required edits.
A member of the Strategic Operations Training Team will reach out for clarity if needed.

Tableau: Self-Service Workspace Area
Tableau allows users to navigate and edit workbooks, sheets, and specific data types using a variety of features. All users have web-edit access through the Self-Service environment, where you can edit Tableau data and visualizations. However, any edits you make must be saved locally to avoid impacting the original Tableau articles. Tableau's Self-Service environment allows users to access, navigate, edit, and create new reports and workbooks using current data sets pulled from NYSERDA's various systems and applications. This page reviews each section of the Self-Service workspace area and is intended to provide an introduction to this topic. After reviewing this material, if you feel like you would benefit from advanced training as it pertains to your role, please use the Self-Service Training Ticket tab to access instructions on how to request training.
Below is an instructional screenshot of the Tableau Self-Service window.

| A | Workbook Name | A workbook contains sheets. A sheet can be a worksheet, a dashboard, or a story. For more information, see Workbooks and Sheets. |
| B | Menu | Use the Menu to access advanced functions of Tableau. |
| C | Tool Bar | Use the toolbar to access commands and analysis, and navigation tools. When creating or editing a report view, use the Toolbar to perform common actions. Hide or Display the Toolbar from the Window menu and selecting Show/Hide Toolbar. |
| D | Side Bar | In a worksheet, the side bar area contains the Data pane and the Analytics pane. |
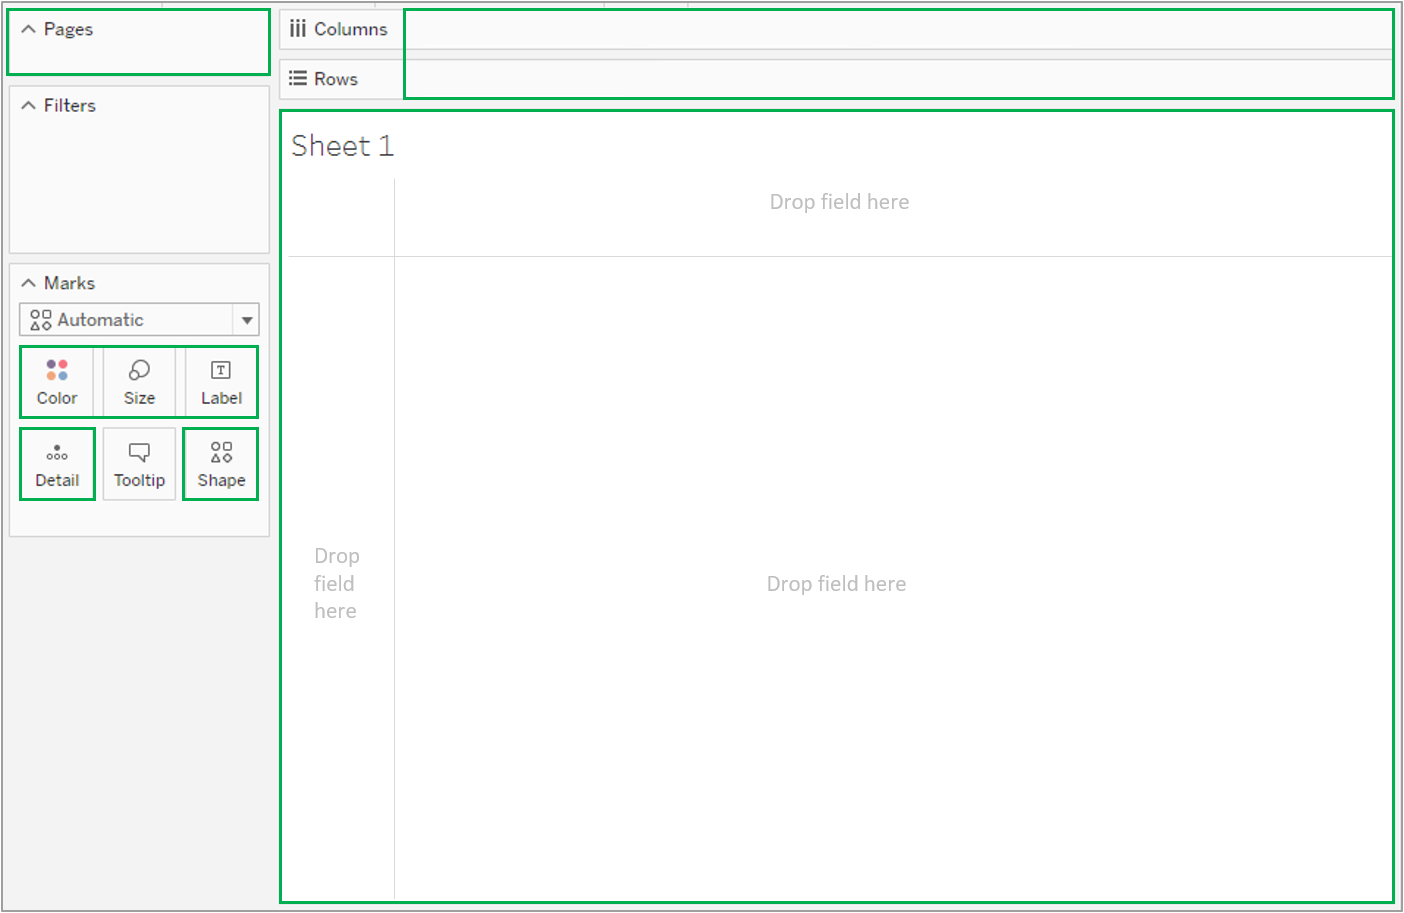
| E | Cards and Shelves | Drag fields to the cards and shelves in the workspace to add data to your view. |
| F | View Area | This is the canvas in the workspace where you create a visualization (also referred to as a viz). |
| G | Sheet Tabs | Tabs represent each sheet in your workbook. This can include worksheets, dashboards, and stories. For more information, see Workbooks and Sheets. |
| H | Status Bar | Displays information about the current view. |

File
Provides access to Save, Save As, Revert, or Close an open worksheet. Revert is only selectable when changes are made to a worksheet.

Worksheet
Provides access to worksheet based controls both during dashboard creation and when viewing published dashboards in Tableau. Refer to the table below for specific details.

New Worksheet | Creates a new worksheet. |
Show Title | Displays the name of your worksheet, story, or dashboard. |
Show Caption | Displays a caption for each view of your dashboard on the caption card when accessing Tableau reports. Captions can be generated automatically or input manually. |
Show View Toolbar | Displays the toolbar at the top of the screen to more easily perform common actions. |
Show Sort Controls | Displays controls that allow more fine tuned sorting. |
Dashboard
Provides access to Add new Dashboards . Additionally, you can Add existing worksheets or new worksheets to the current dashboard.

Analysis
Provides access to add or edit Calculated Fields.

Stack Marks | Relevant when your data view includes numeric axes. When marks are stacked, they are drawn cumulatively along an axis. |
Totals | Calculate either grand totals and subtotals. Totals can also be customized. |
Filters | Display formatted and interactive filters in the view. |
Highlighters | Allow you to call attention to marks of interest by highlighting specific information while dimming others. |
Map
Allows the ability to choose between Background Maps.

Format
Provides access to Edit a workbook, Clear worksheet formatting, or Adjust format animations.

Help
Provides access to Tableaus online help and support resources.

Tableau Desktop Application
Hide Side Bar
Click the collapse arrow in the side bar.

Show Side Bar
Click the expand arrow in the bottom-left of the workspace (on the status bar).

Tableau Cloud Application
Hide Side Bar
Click the collapse arrow in the side bar.

Show Side Bar
Click the expand arrow in the side bar.

For example, the status in the example screenshot below shows that the view has 143 marks shown in 3 rows and 12 columns. It also shows that the SUM(Sales) for all the marks in the view is $2,297,201 .

Measures
Measures are numeric, quantifiable fields you can use in your data to get aggregated values of the data. When you drag a measure into the view, Tableau applies an aggregation to that measure (by default).
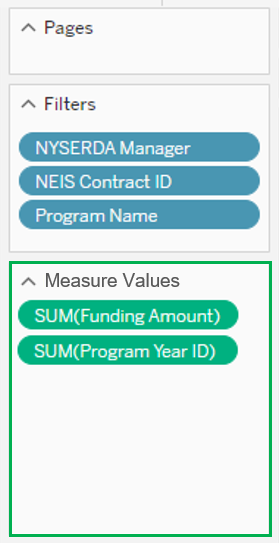
Dimensions
Dimensions contain qualitative values (such as names, dates, or geographical data). You can use dimensions to categorize, segment, and reveal the details in your data. Dimensions affect the level of detail in the view.
Adding a Dimension to any of the following locations in Tableau affects the level of detail:
FAQ
Data
The Data Tab allows users to implement fields with calculations specific to the source worksheet. Any data types within the Data Tab can be dragged and dropped into the sheet to create columns or rows for analysis.

Analytics
The Analytics Tab provides tools to summarize and model visualizations of the data in the worksheet. You can create different trend-lines and plots after dragging and dropping data types into the sheet. The Analytics functions can only be used on numerical data types.

Access the Knowledge Base home page.
In the introductory description of the Knowledge Base, click on the hyperlink that allows you to submit a request to the Strategic Operations Training Team.
Fill out the subsequent form. The Subject of the request should be Additional Tableau Training. At the end of the form, include the specific areas of Tableau you would like more training on.
Submit the form, and a member of the Strategic Operations Training Team will reach out to you shortly with details on further training.
Overview
Content Tools