| Aura - Tab |
|---|
|
| Info |
|---|
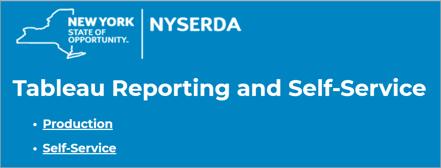
| Tableau general users have read-only access to all dashboards and visualizations. Users can otherwise edit data as needed without making any changes to original visualizations in the Self-Service environment, which is a sandbox for further data analysis. To access certain functionalities, detailed below, users must submit an IT Service Request Ticket to gain the correct permissions and software for the use-case. |
| Aura - Panel |
|---|
| tab | 1 |
|---|
| styles | {"body":{"text":{"color":"#002d72","textAlign":"left","fontWeight":"normal","fontSize":14}},"header":{"backgroundColor":{"color":"#f3f4f9"}},"headline":{"alignment":{"horizontal":"start"},"text":{"text":"Creating New Datasets and/or Dashboards in Tableau","color":"#002d72","textAlign":"left","fontWeight":"bold","fontSize":18}},"base":{"backgroundColor":{"color":"#ffffff"},"borderRadius":{"radius":4},"boxShadow":{"shadows":[{"color":"rgba(0, 0, 0, 0.08)","x":0,"y":1,"blur":1,"spread":0},{"color":"rgba(0, 0, 0, 0.16)","x":0,"y":1,"blur":3,"spread":1}]}}} |
|---|
| body | <p><br /></p> |
|---|
|
| Expand |
|---|
|
| Info |
|---|
| A user is ecouraged to use the | UI Button |
|---|
| color | blue |
|---|
| size | small |
|---|
| title | Dashboard Requirements |
|---|
| url | https://knowledge.nyserda.ny.gov/download/attachments/59605501/Dashboard%20Requirements%20Template.docx?api=v2 |
|---|
|
template as a resource to think about the commen questions and the different features Tableau has, to help clearify the requirements needed for the Data Maps and Visualizations Team to generate the dashboard. You should expect the Data Maps and Visualizations Team to reach out to schedule a discovery conversation upon submitting the ticket. |
| UI Steps |
|---|
|
| UI Step |
|---|
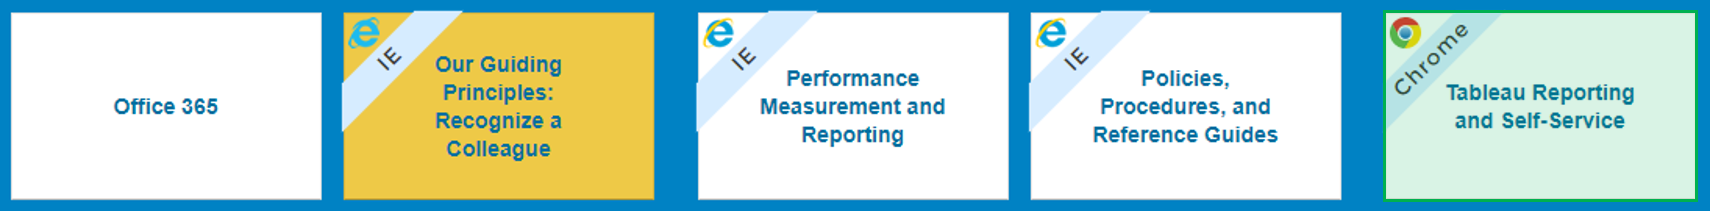
Click on Service Desk (IT & Facilitaties) panel through the NYSERDA Launch Page. |
| UI Step |
|---|
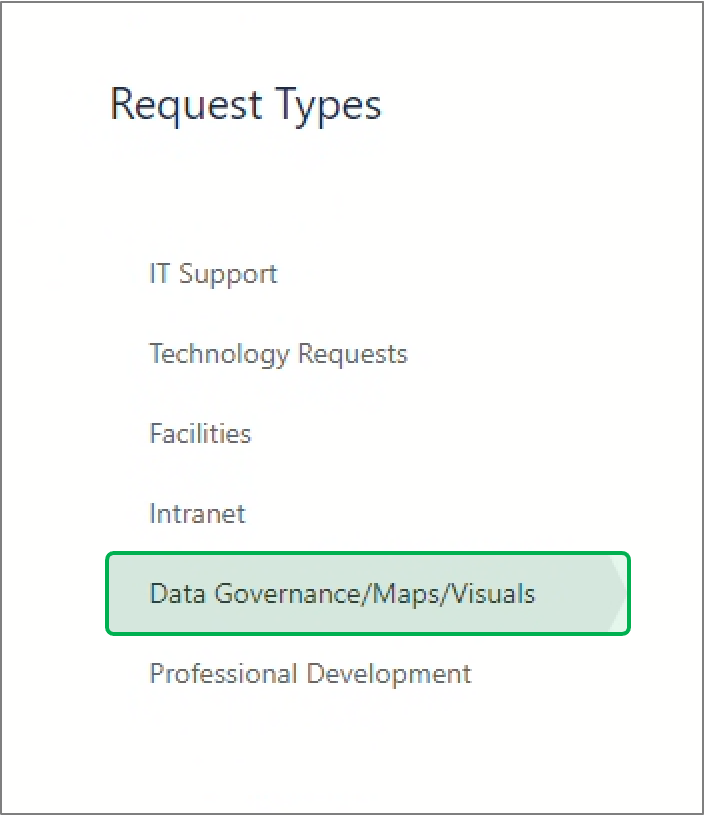
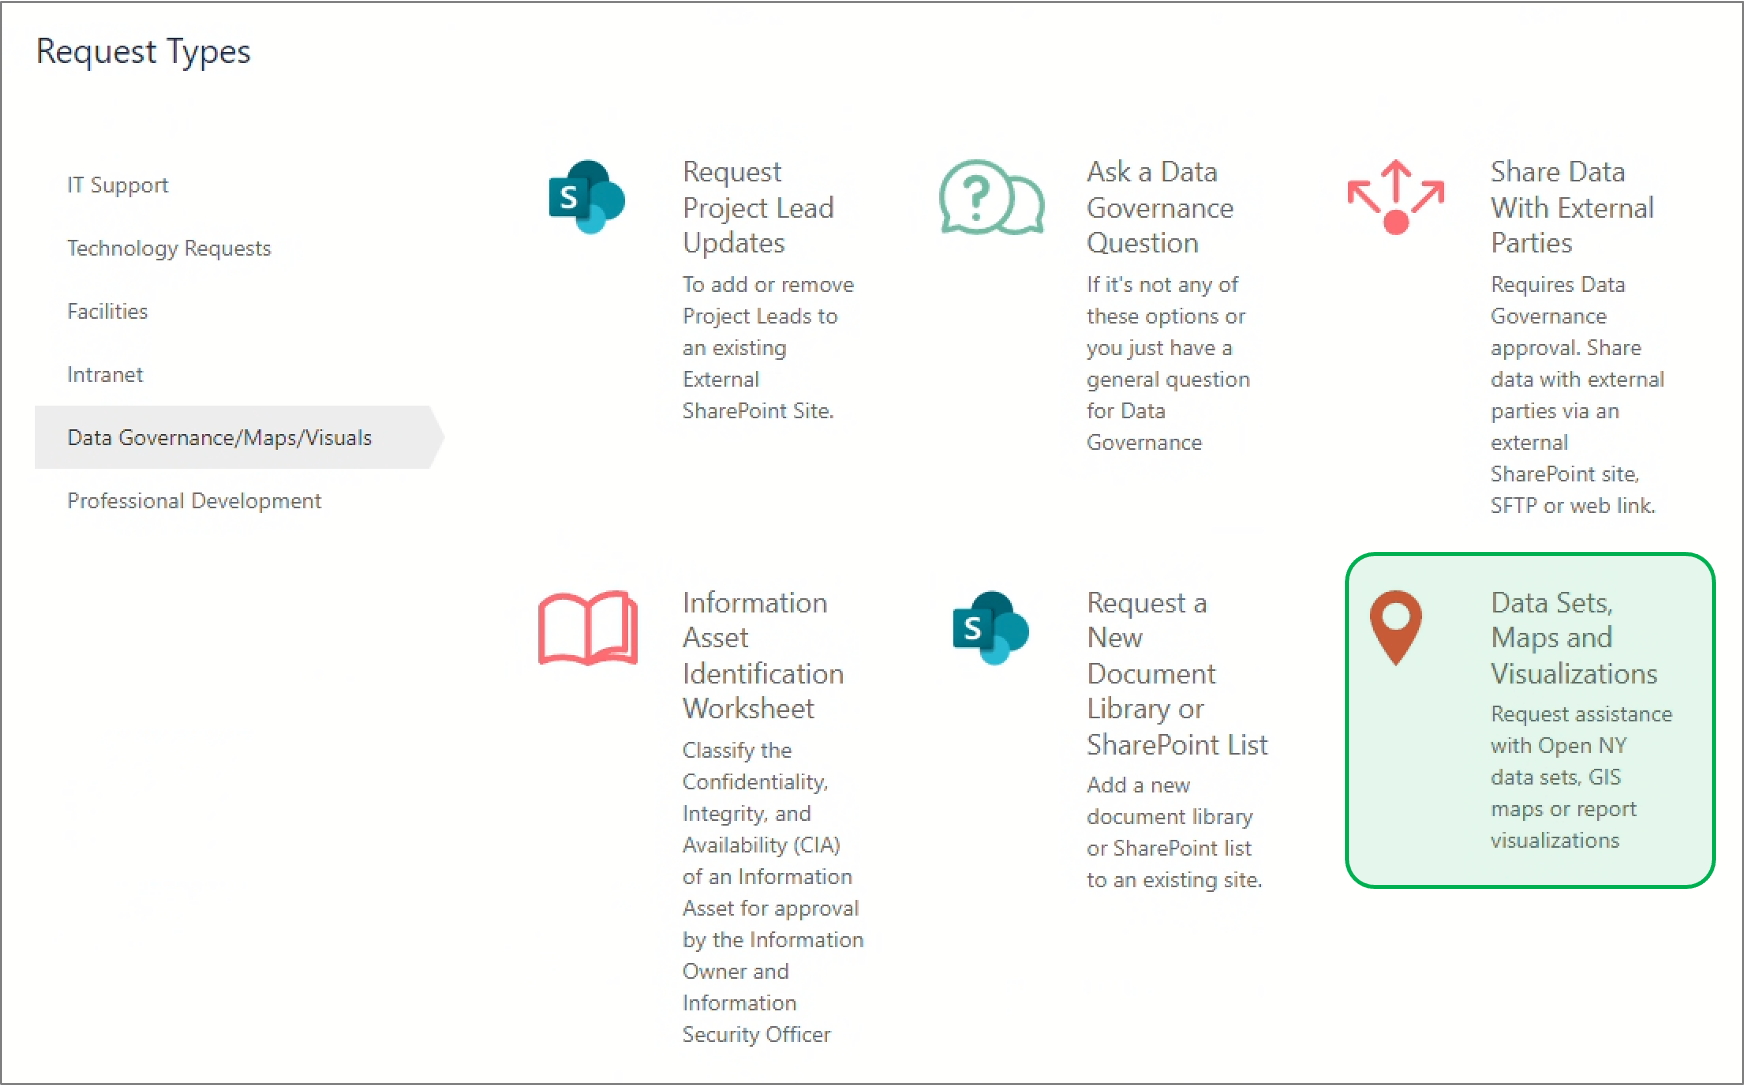
Scroll down on the page and click on the Data Governance/Maps/Visuals tab on the left. | Expand |
|---|
| 
|
|
| UI Step |
|---|
Within the Data Governance/Maps/Visuals tab, select the Data Sets, Maps and Visualizations ticket type. | Expand |
|---|
| 
|
|
| UI Step |
|---|
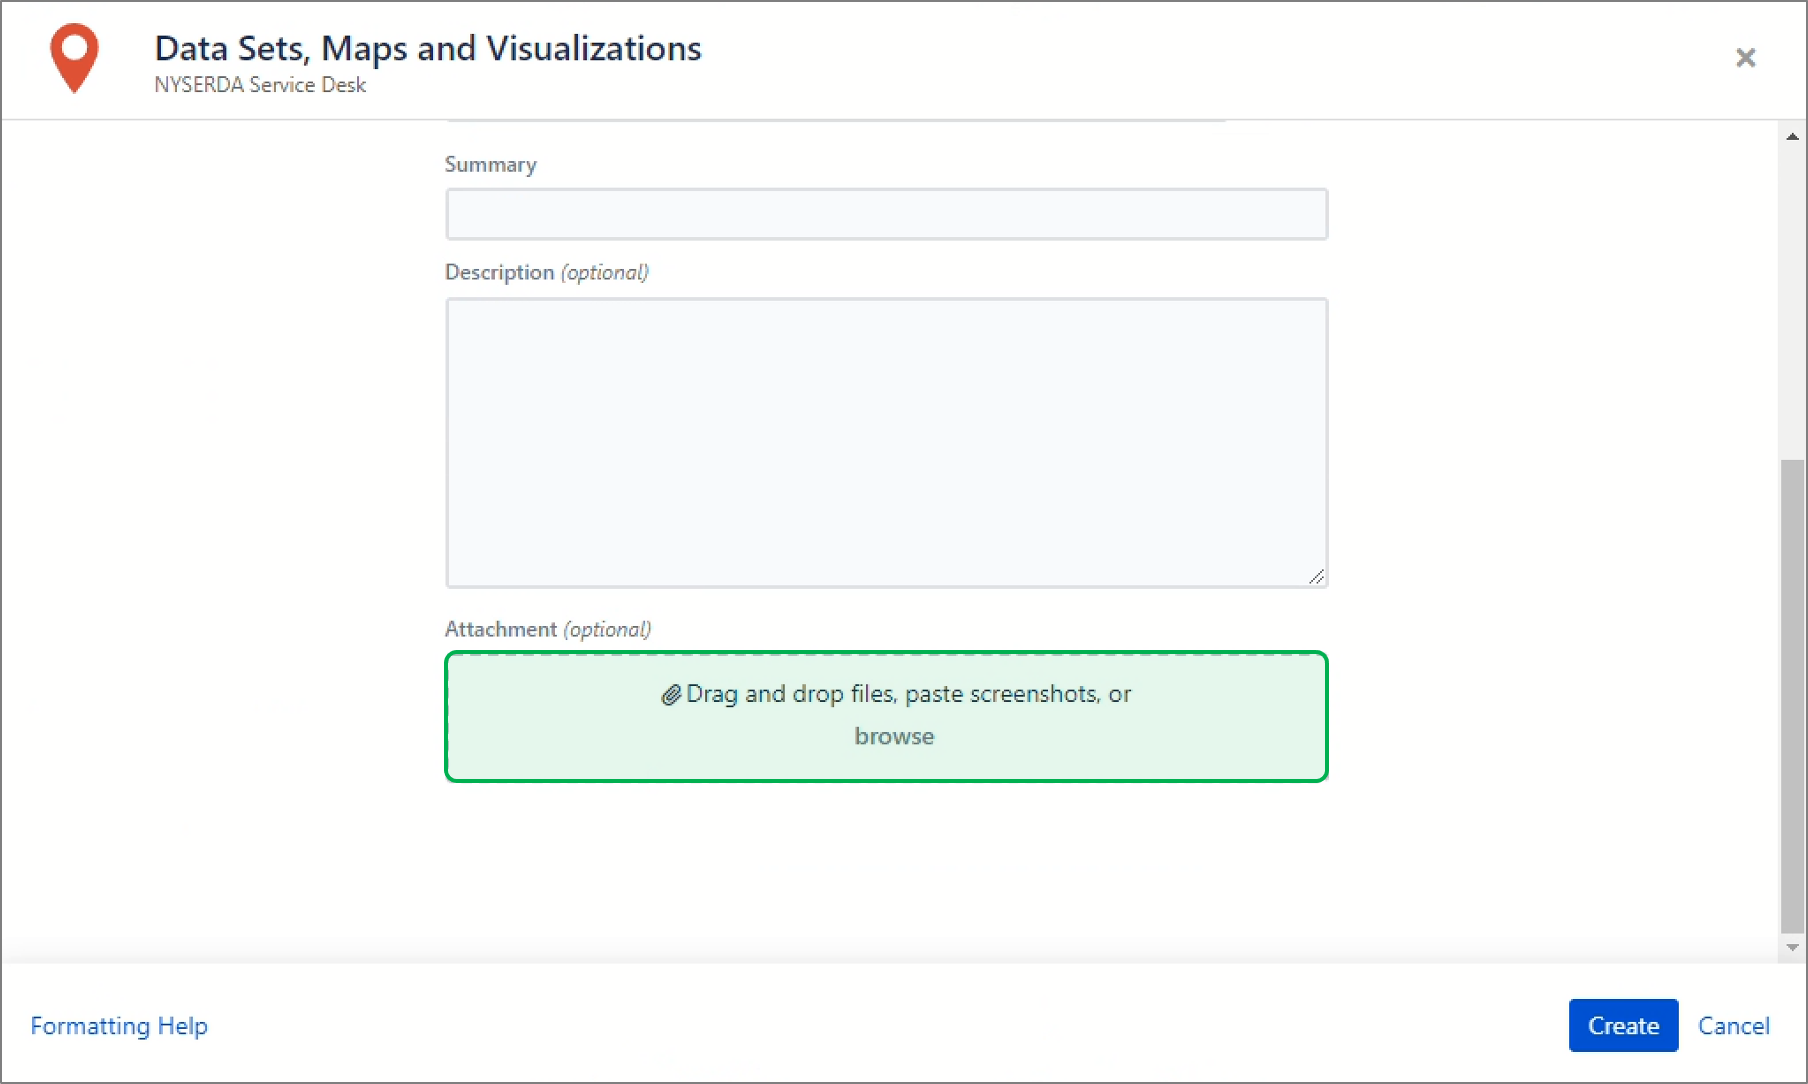
If the Dashboard Requirement Template was leveraged, drag and drop the template within the Attachment box. | Expand |
|---|
| 
|
|
| UI Step |
|---|
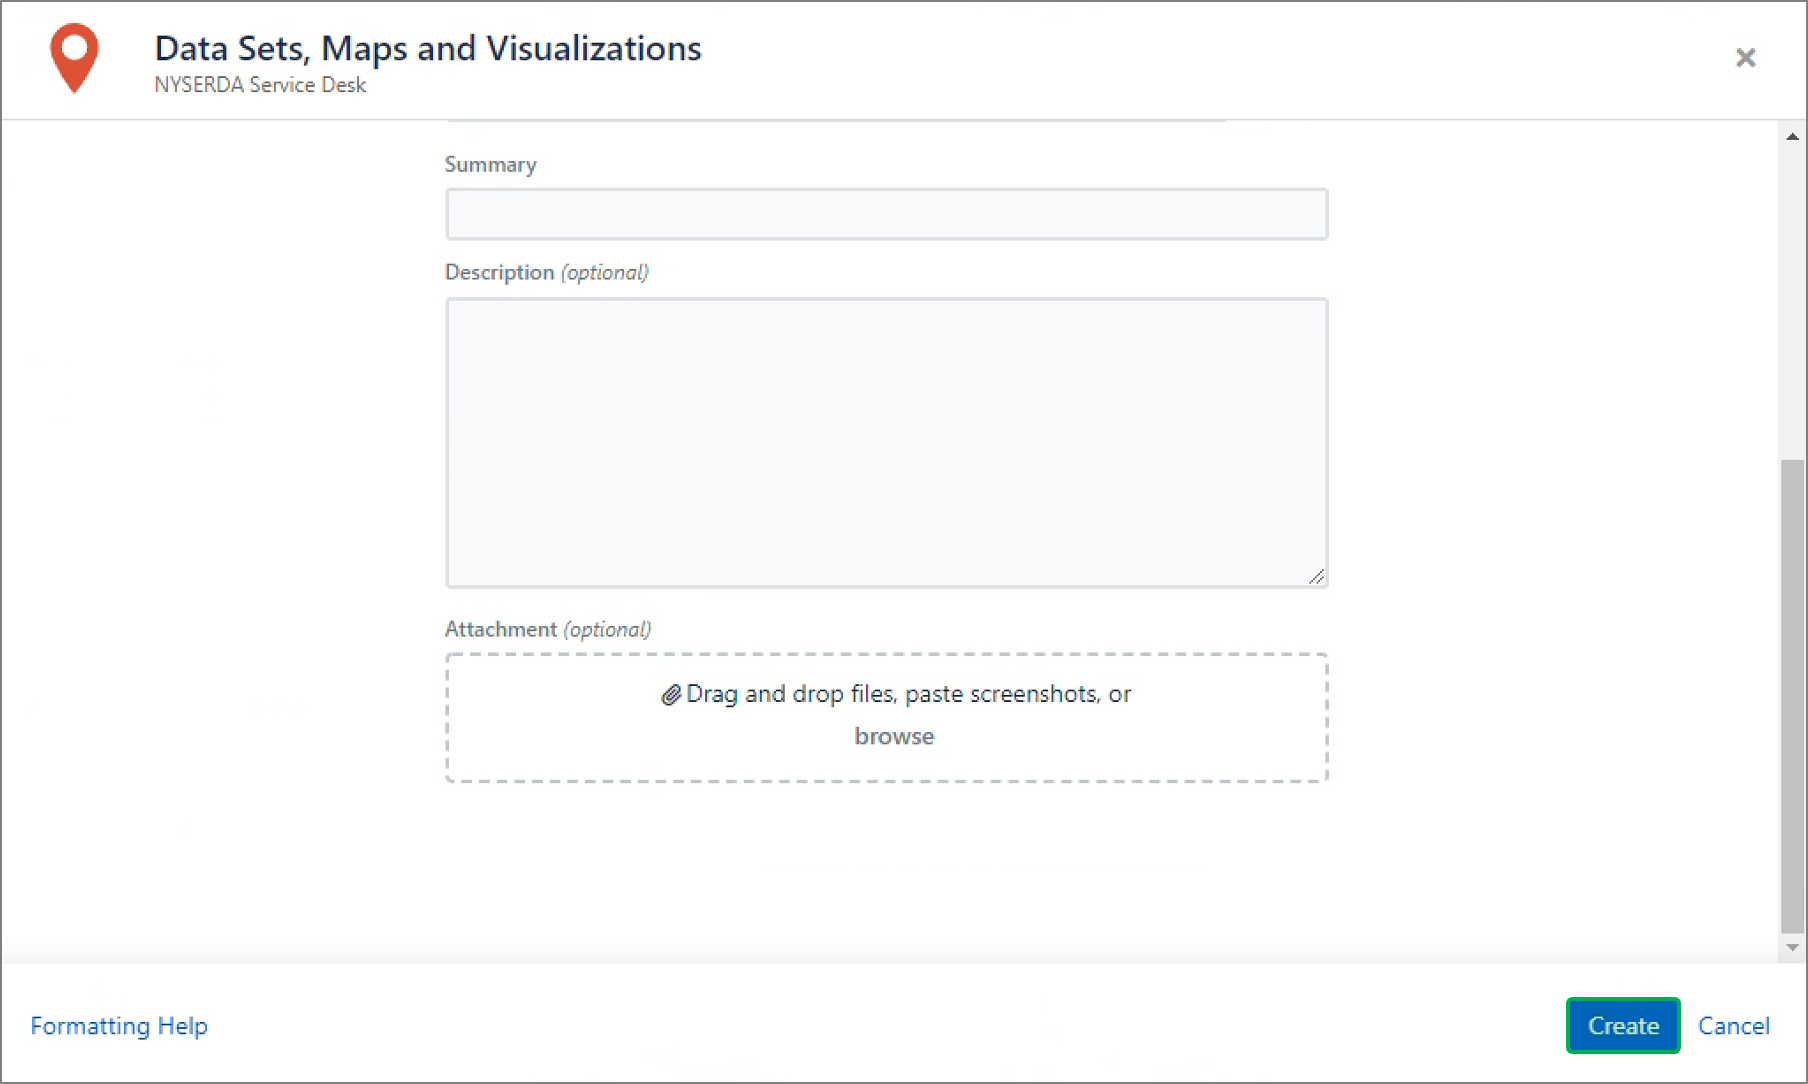
Click Create at the bottom when complete to submit the ticket. | Expand |
|---|
| 
|
|
|
|
|
| Aura - Panel |
|---|
| tab | 1 |
|---|
| styles | {"body":{"text":{"color":"#002d72","textAlign":"left","fontWeight":"normal","fontSize":14}},"header":{"backgroundColor":{"color":"#f3f4f9"}},"headline":{"alignment":{"horizontal":"start"},"text":{"text":"Request Tableau Desktop Software Access","color":"#002d72","textAlign":"left","fontWeight":"bold","fontSize":18}},"base":{"backgroundColor":{"color":"#ffffff"},"borderRadius":{"radius":4},"boxShadow":{"shadows":[{"color":"rgba(0, 0, 0, 0.08)","x":0,"y":1,"blur":1,"spread":0},{"color":"rgba(0, 0, 0, 0.16)","x":0,"y":1,"blur":3,"spread":1}]}}} |
|---|
| body | <p><br /></p> |
|---|
|
| Expand |
|---|
|
| UI Steps |
|---|
|
| UI Step |
|---|
Click on Service Desk (IT & Facilitaties) panel through the NYSERDA Launch Page. |
| UI Step |
|---|
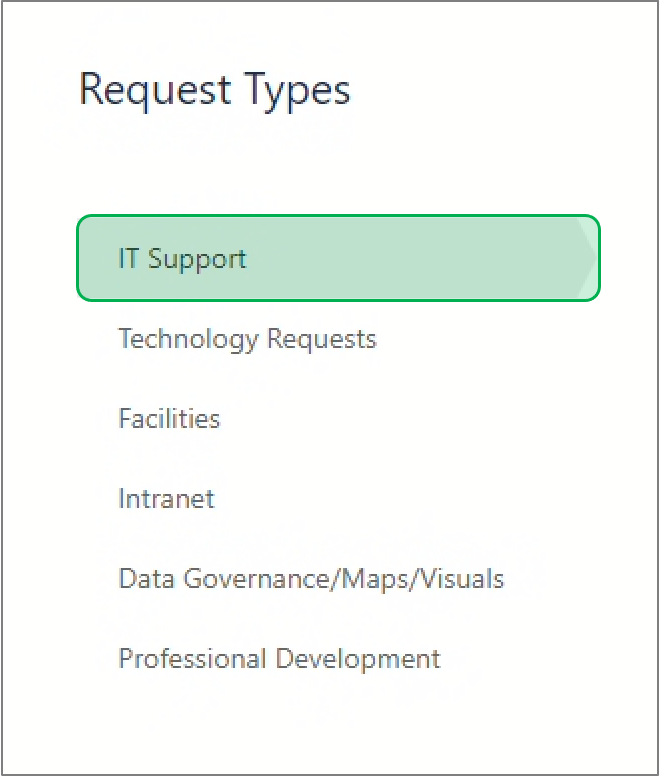
Scroll down on the page and click on the IT Support tab on the left. | Expand |
|---|
| 
|
|
| UI Step |
|---|
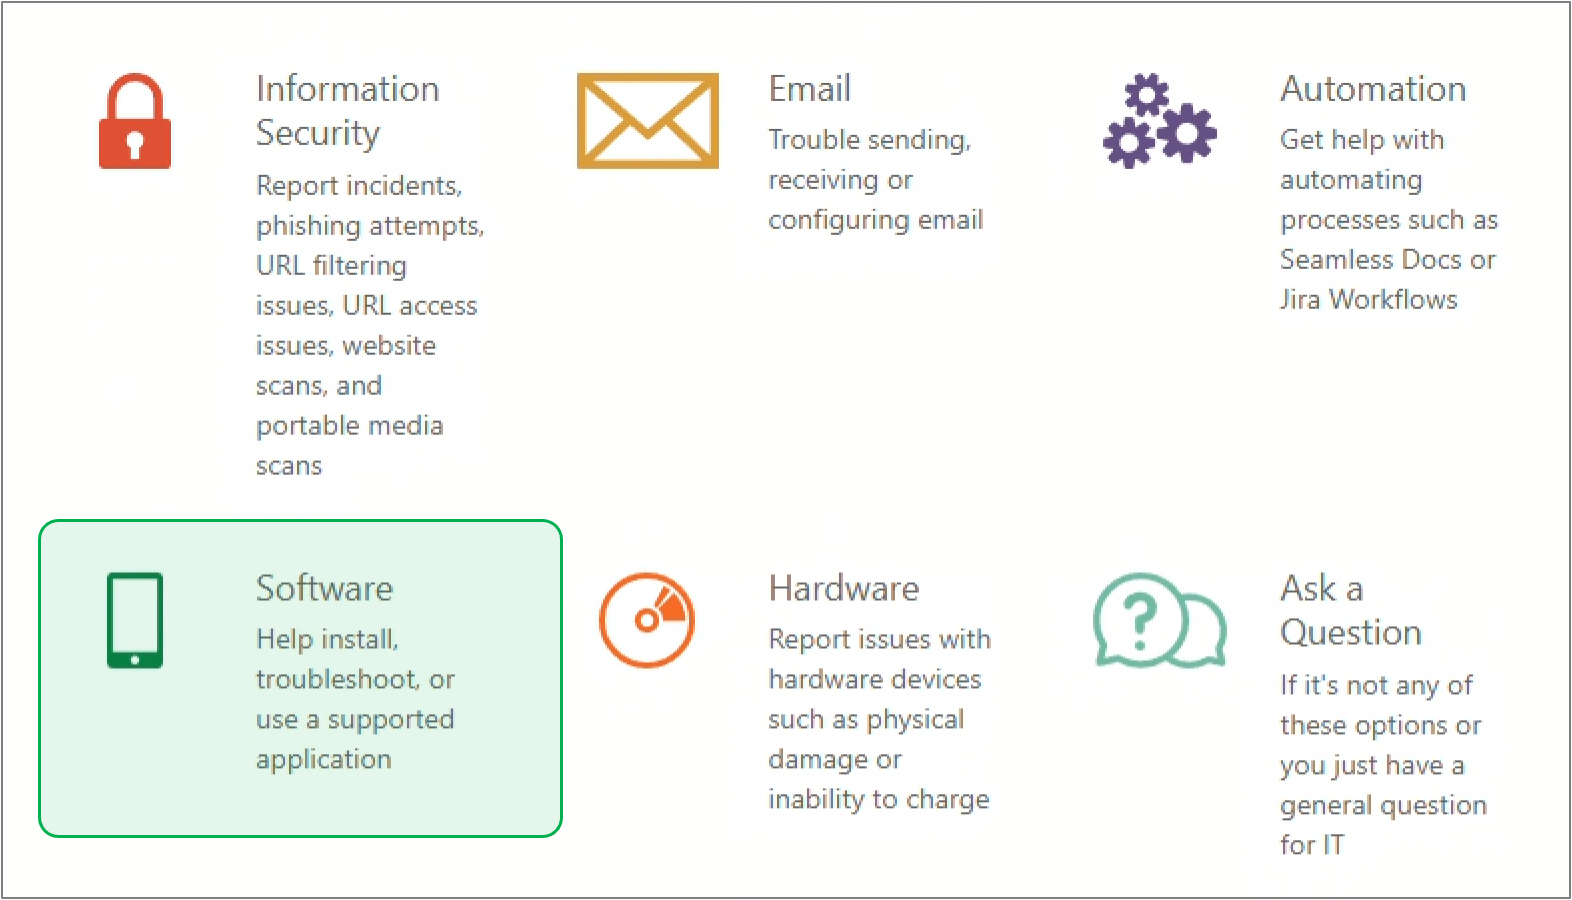
Within the IT Support tab, select the Software Ticket Type. | Expand |
|---|
| 
|
|
| UI Step |
|---|
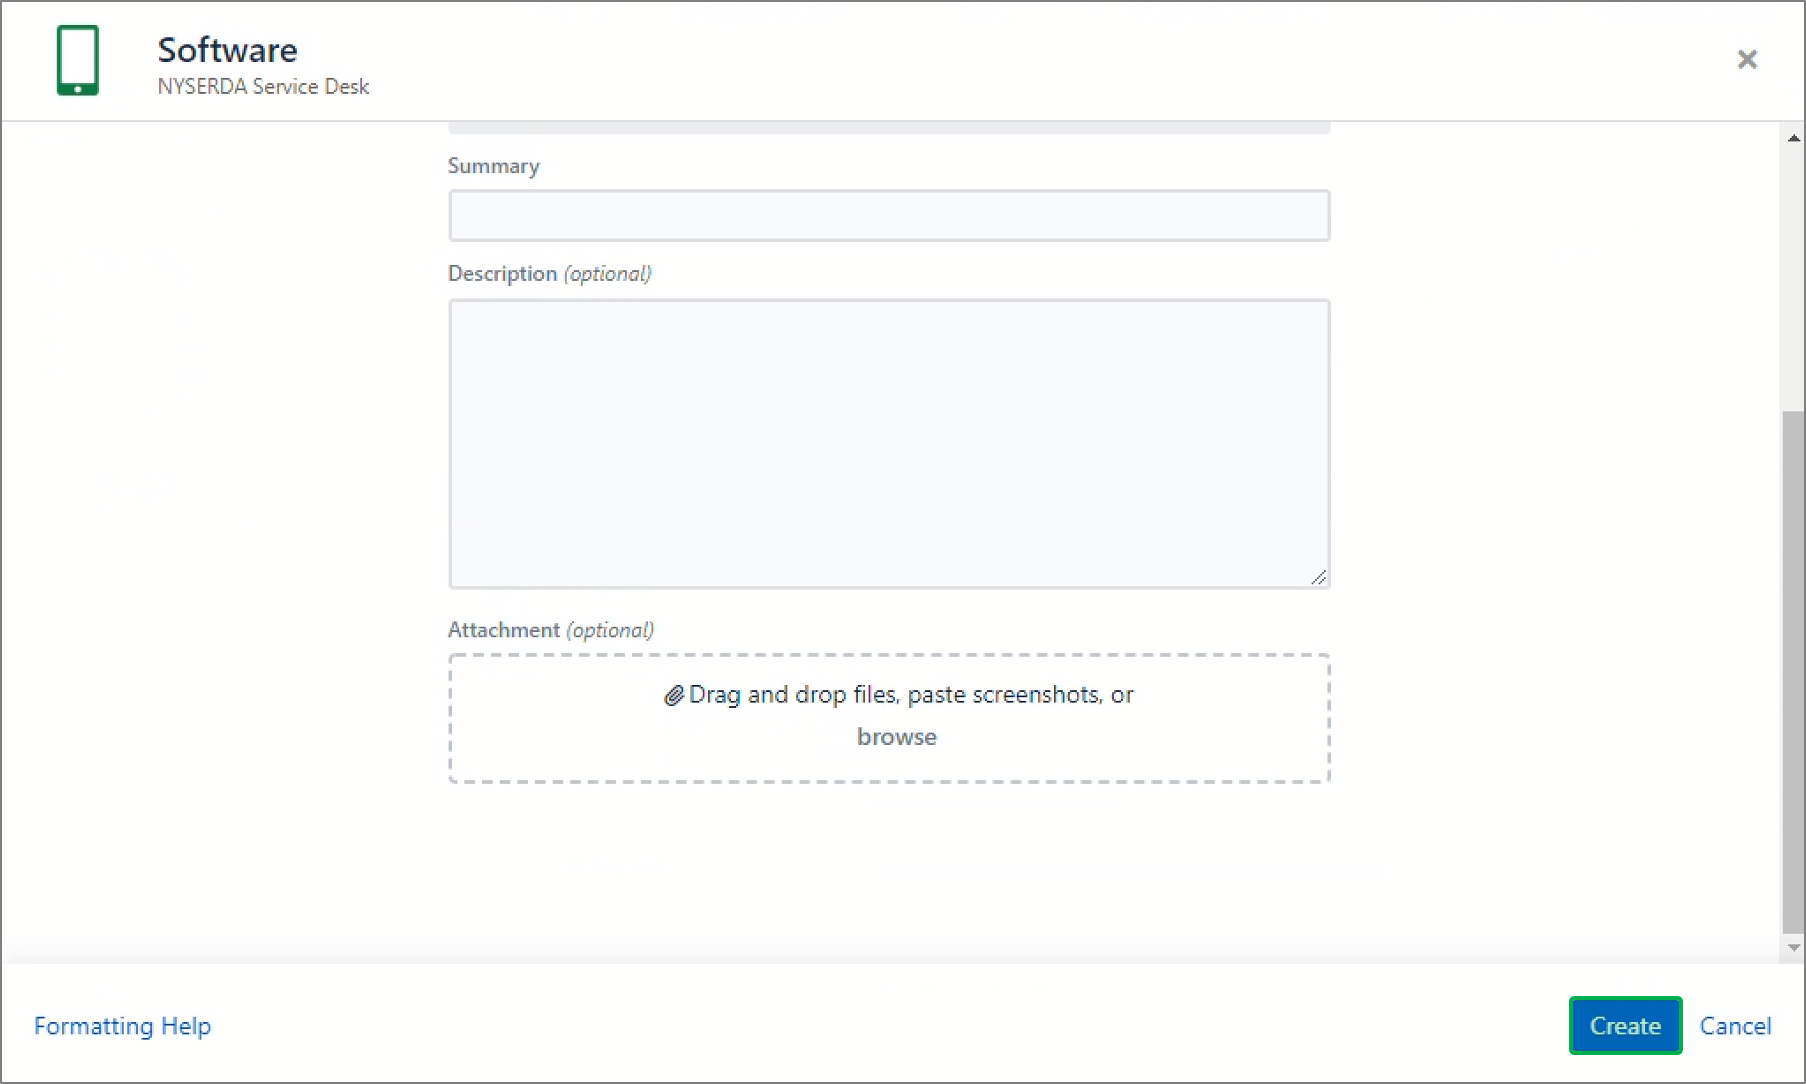
Click Create at the bottom when complete to submit the ticket. | Expand |
|---|
| 
|
|
|
|
|
|
| Aura - Tab |
|---|
| title | Additional Resources |
|---|
|
| Aura - Panel |
|---|
| tab | 1 |
|---|
| styles | {"body":{"text":{"color":"#002d72","textAlign":"left","fontWeight":"normal","fontSize":14}},"header":{"backgroundColor":{"color":"#f3f4f9"}},"headline":{"alignment":{"horizontal":"start"},"text":{"text":"Tableau Learning","color":"#002d72","textAlign":"left","fontWeight":"bold","fontSize":18}},"base":{"backgroundColor":{"color":"#ffffff"},"borderRadius":{"radius":4},"boxShadow":{"shadows":[{"color":"rgba(0, 0, 0, 0.08)","x":0,"y":1,"blur":1,"spread":0},{"color":"rgba(0, 0, 0, 0.16)","x":0,"y":1,"blur":3,"spread":1}]}}} |
|---|
| body | <p><br /></p> |
|---|
| Tableau has a compilation of video tutorials, practical training, and documentation that users may use to better understand how to navigate through different Tableau functions. These are accessible through the Learning tab on the Tableau website, tableau.com. (This is a direct link to the Tableau website, NOT the Tableau Application.) |
| Aura - Panel |
|---|
| tab | 1 |
|---|
| styles | {"body":{"text":{"color":"#002d72","textAlign":"left","fontWeight":"normal","fontSize":14}},"header":{"backgroundColor":{"color":"#f3f4f9"}},"headline":{"alignment":{"horizontal":"start"},"text":{"text":"Data Plus Science Website","color":"#002d72","textAlign":"left","fontWeight":"bold","fontSize":18}},"base":{"backgroundColor":{"color":"#ffffff"},"borderRadius":{"radius":4},"boxShadow":{"shadows":[{"color":"rgba(0, 0, 0, 0.08)","x":0,"y":1,"blur":1,"spread":0},{"color":"rgba(0, 0, 0, 0.16)","x":0,"y":1,"blur":3,"spread":1}]}}} |
|---|
| body | <p><br /></p> |
|---|
| In addition to the Knowledge Base, you can access more Tableau Training by going to dataplusscience.com and accessing the Tableau Reference Guide in the Learn More section. |
|
|