Topic Overview


The Tableau workspace is a powerful and fast growing data visualization tool. Tableau simplifies raw data into easily understandable visual formats. Users can analyze data and create various forms of dashboards and worksheets quickly and easily. With its easy navigation and configuration tools, Tableau allows users to visualize all their data in one central location. 


Select the Tableau Reporting and Self-Service  Tab from the bottom of the NYSERDA Launch page.


One the next screen, select either Production or Self-Service.

Production

The Production environment in Tableau gives users view/read-only access to all if its visualizations. Users can filter workbooks and visualizations to create specific views, which they can save for later use. However, users cannot edit the data or visualizations beyond setting filters.

Users can access a project report/workbook or dashboard directly through Tableau (as shown in Tableau) or through Dashboard Central which can also be found on the Launch Page. Once a user chooses and enters a dashboard, they can switch between different tabs of the workbook, similar to how users can switch between tabs on an Excel Workbook.


Self-ServiceAll users have web-edit access through the Self-Serving environment, where they can edit Tableau data and visualizations however they need and save them locally without affecting the original Tableau articles. To visualize data in different formats, click on Show Me and it proposes different types of visuals for the data.


Regardless of which option you choose, you'll be brought to Tableau's home page.


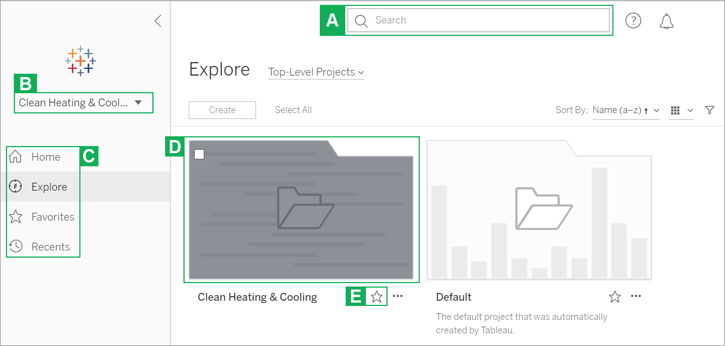
Letter

FunctionDescription
ASearchUse the search engine to locate reports and sites within Tableau.
BSite SelectionIf you selected the wrong site when logging into Tableau Production, you can use this drop-down to navigate to other Tableau sites.
CControlsUse these controls to navigate between different Tableau views.
DReport FoldersThe folders shown in this section contain the varied reports and views stored in each Tableau site.
EFavoriteClicking this icon below any report folder or view will save the access link in your Favorites control option in the left hand navigation pane for easier access in the future.


Tableau general users have read-only access to all dashboards and visualizations. Users can otherwise edit data as needed without making any changes to original visualizations in the Self-Service environment, which is a sandbox for further data analysis. 

To access certain functionalities, detailed below, users must submit an IT Service Request Ticket to gain the correct permissions and software for the use-case.


A user is ecouraged to use the template as a resource to think about the commen questions and the different features Tableau has, to help clearify the requirements needed for the Data Maps and Visualizations Team to generate the dashboard. 

You should expect the Data Maps and Visualizations Team to reach out to schedule a discovery conversation upon submitting the ticket.


Click on Service Desk (IT & Facilitaties) panel through the NYSERDA Launch Page.


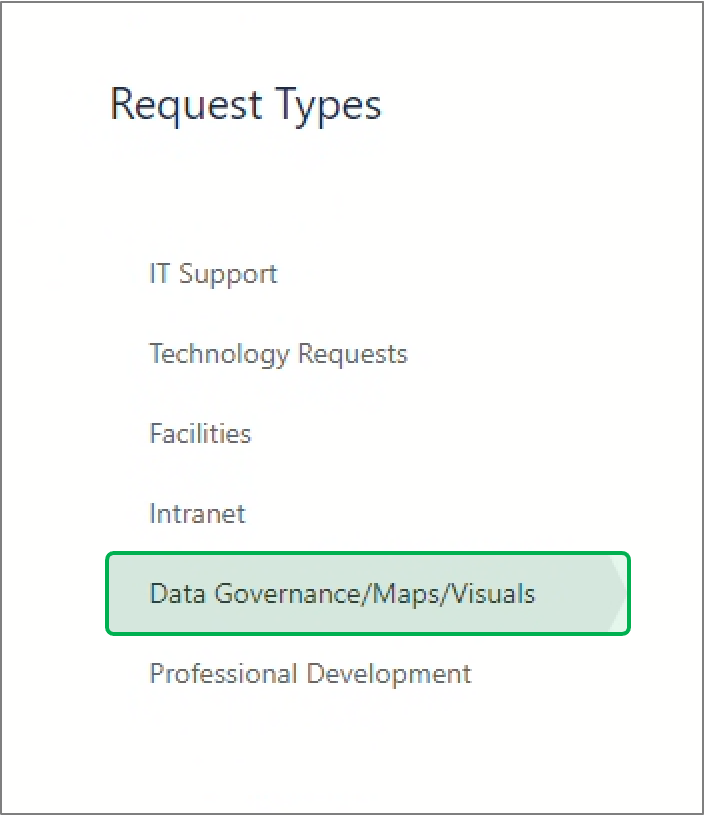
Scroll down on the page and click on the Data Governance/Maps/Visuals tab on the left.


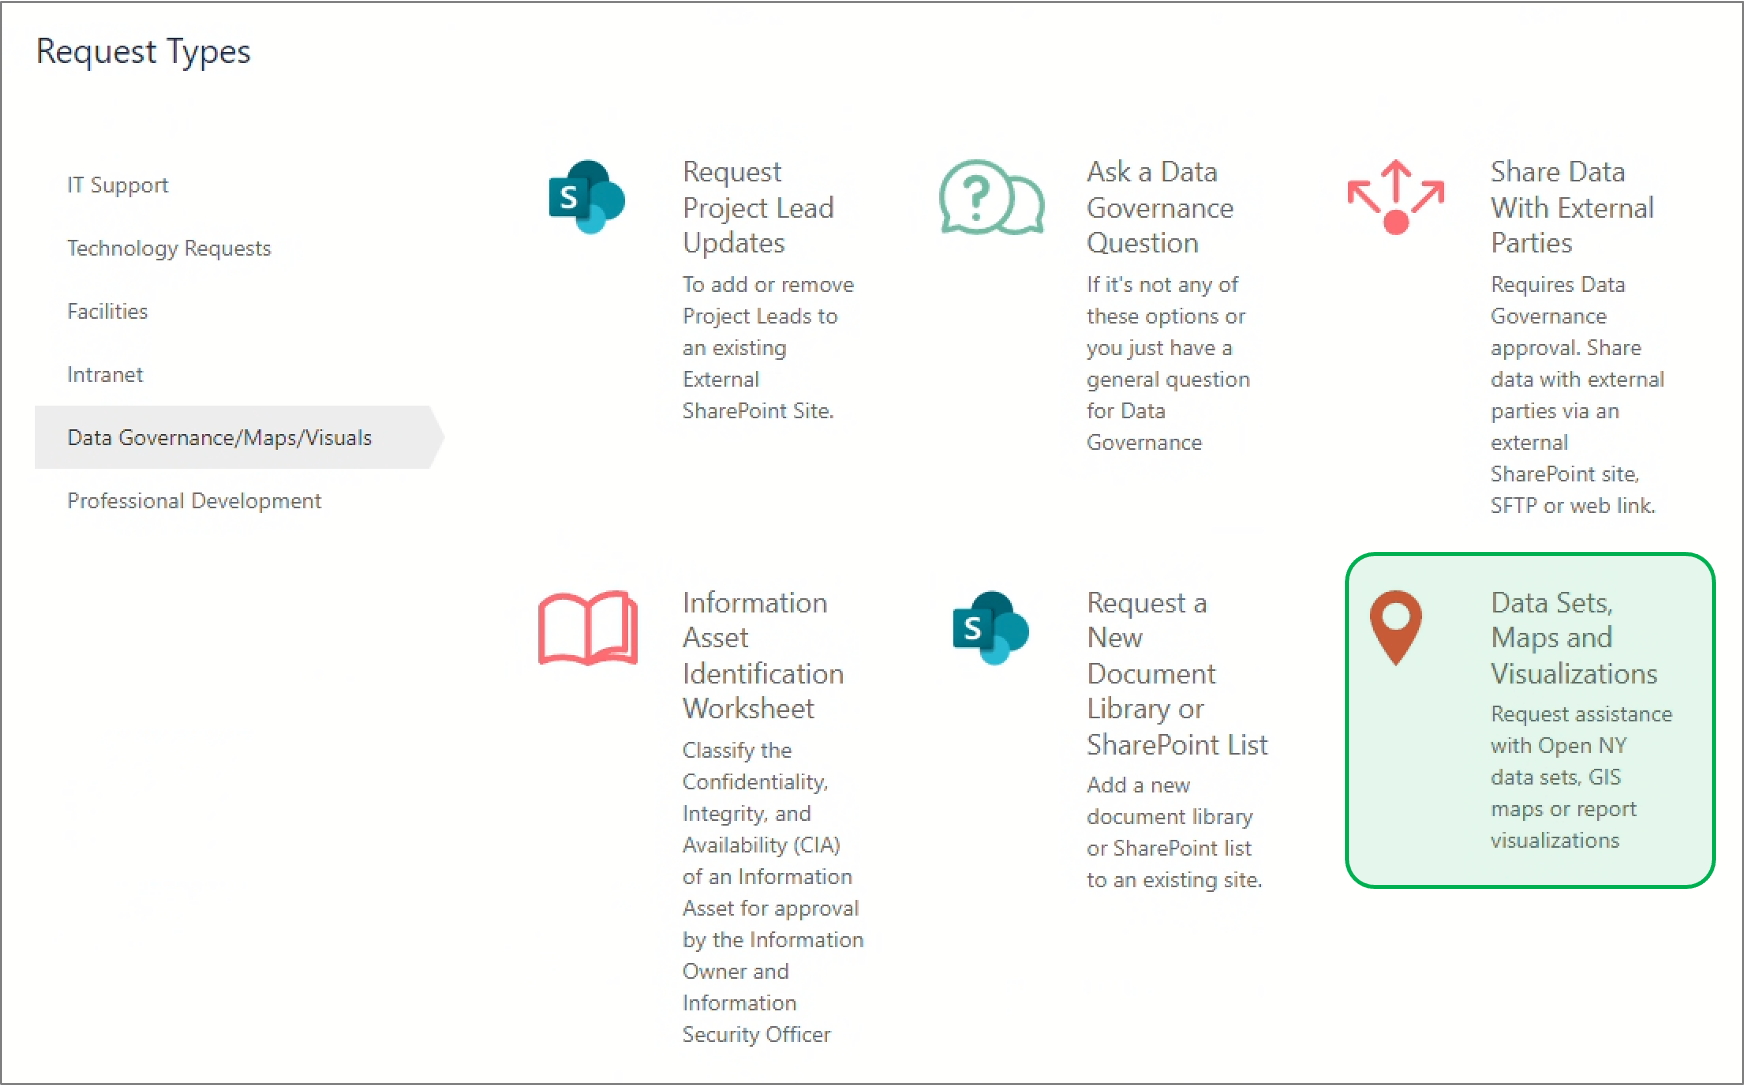
Within the Data Governance/Maps/Visuals tab, select the Data Sets, Maps and Visualizations ticket type.


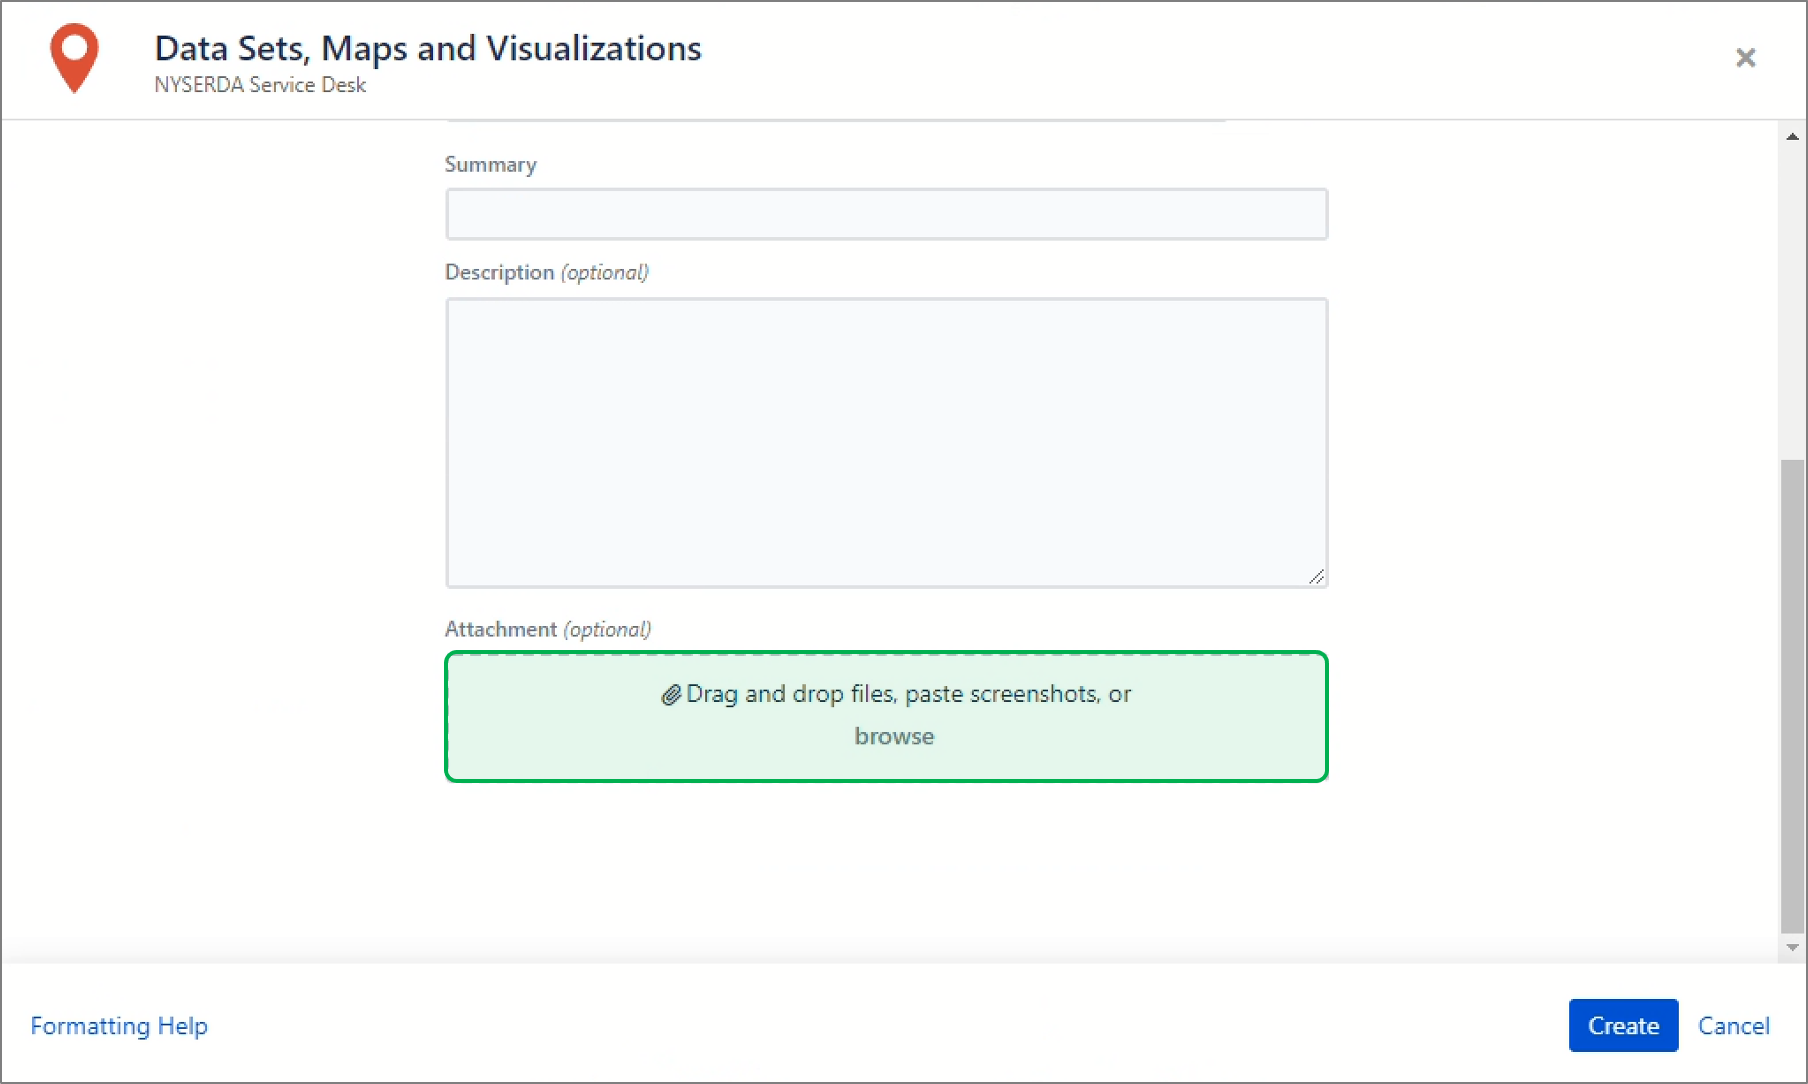
If the Dashboard Requirement Template was leveraged, drag and drop the template within the Attachment box.


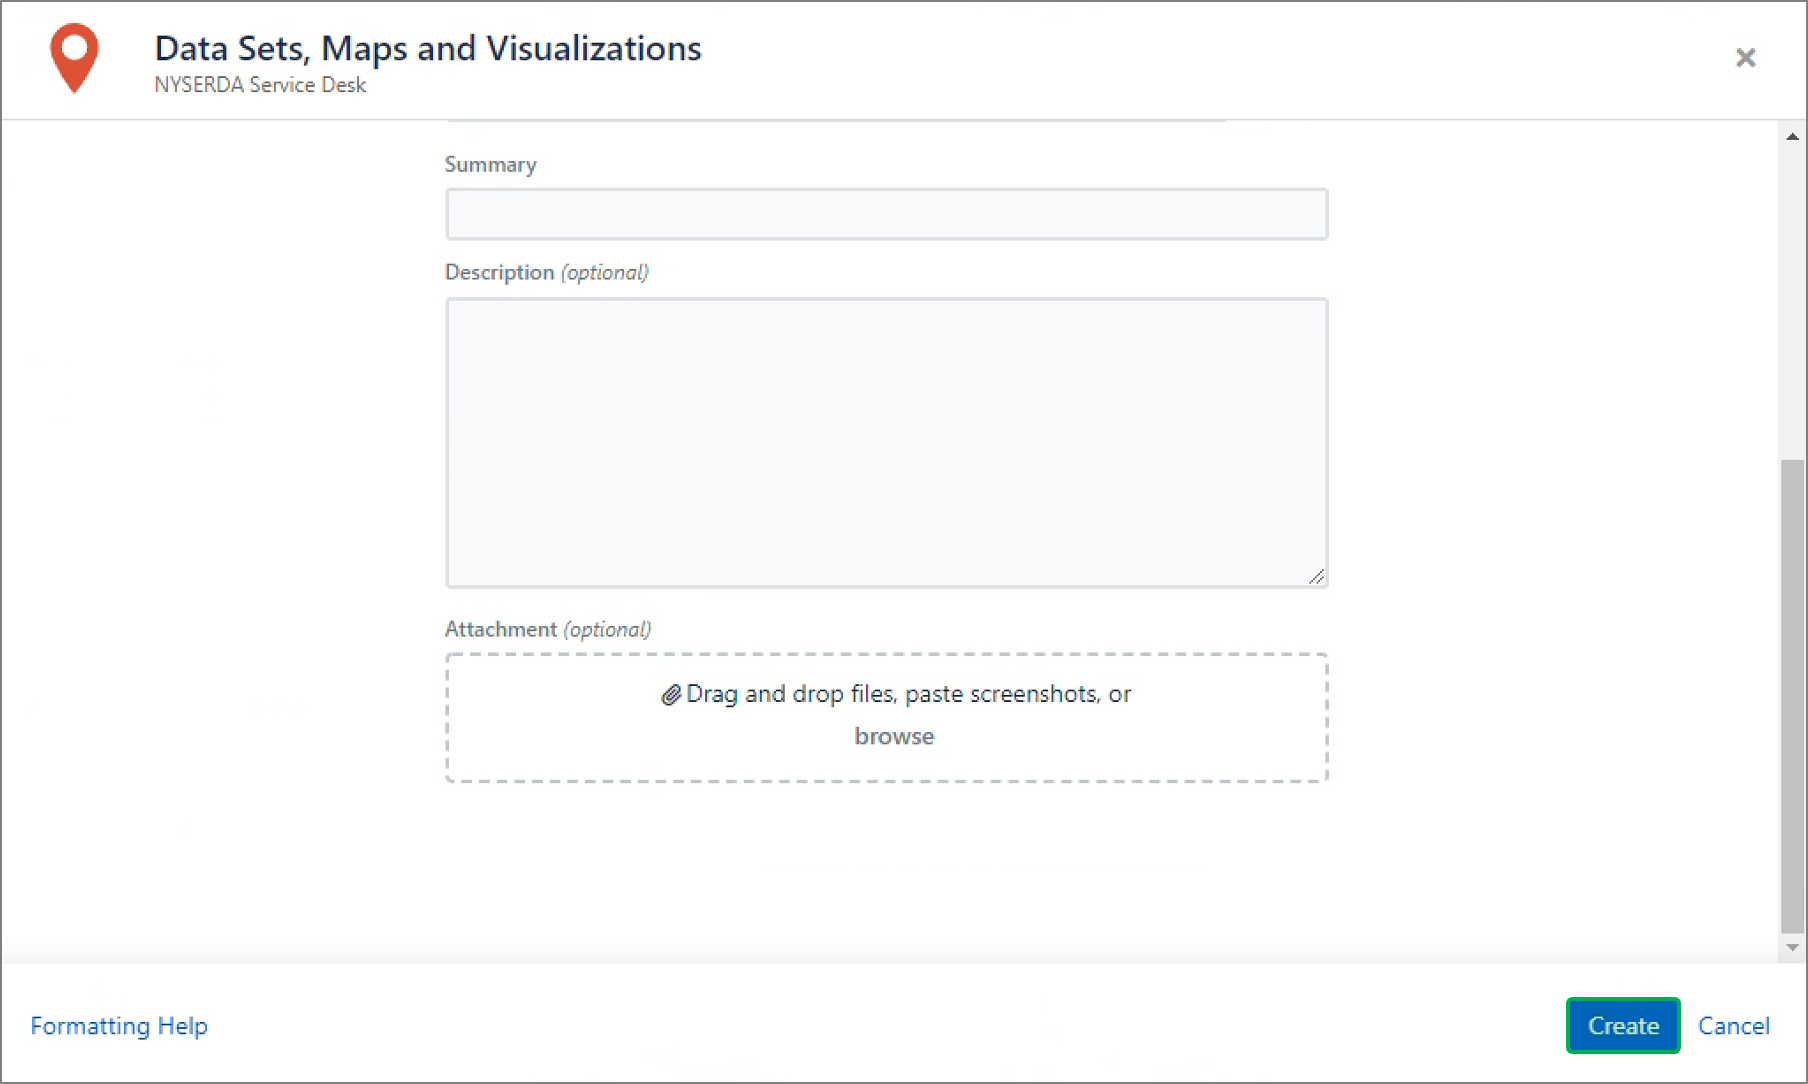
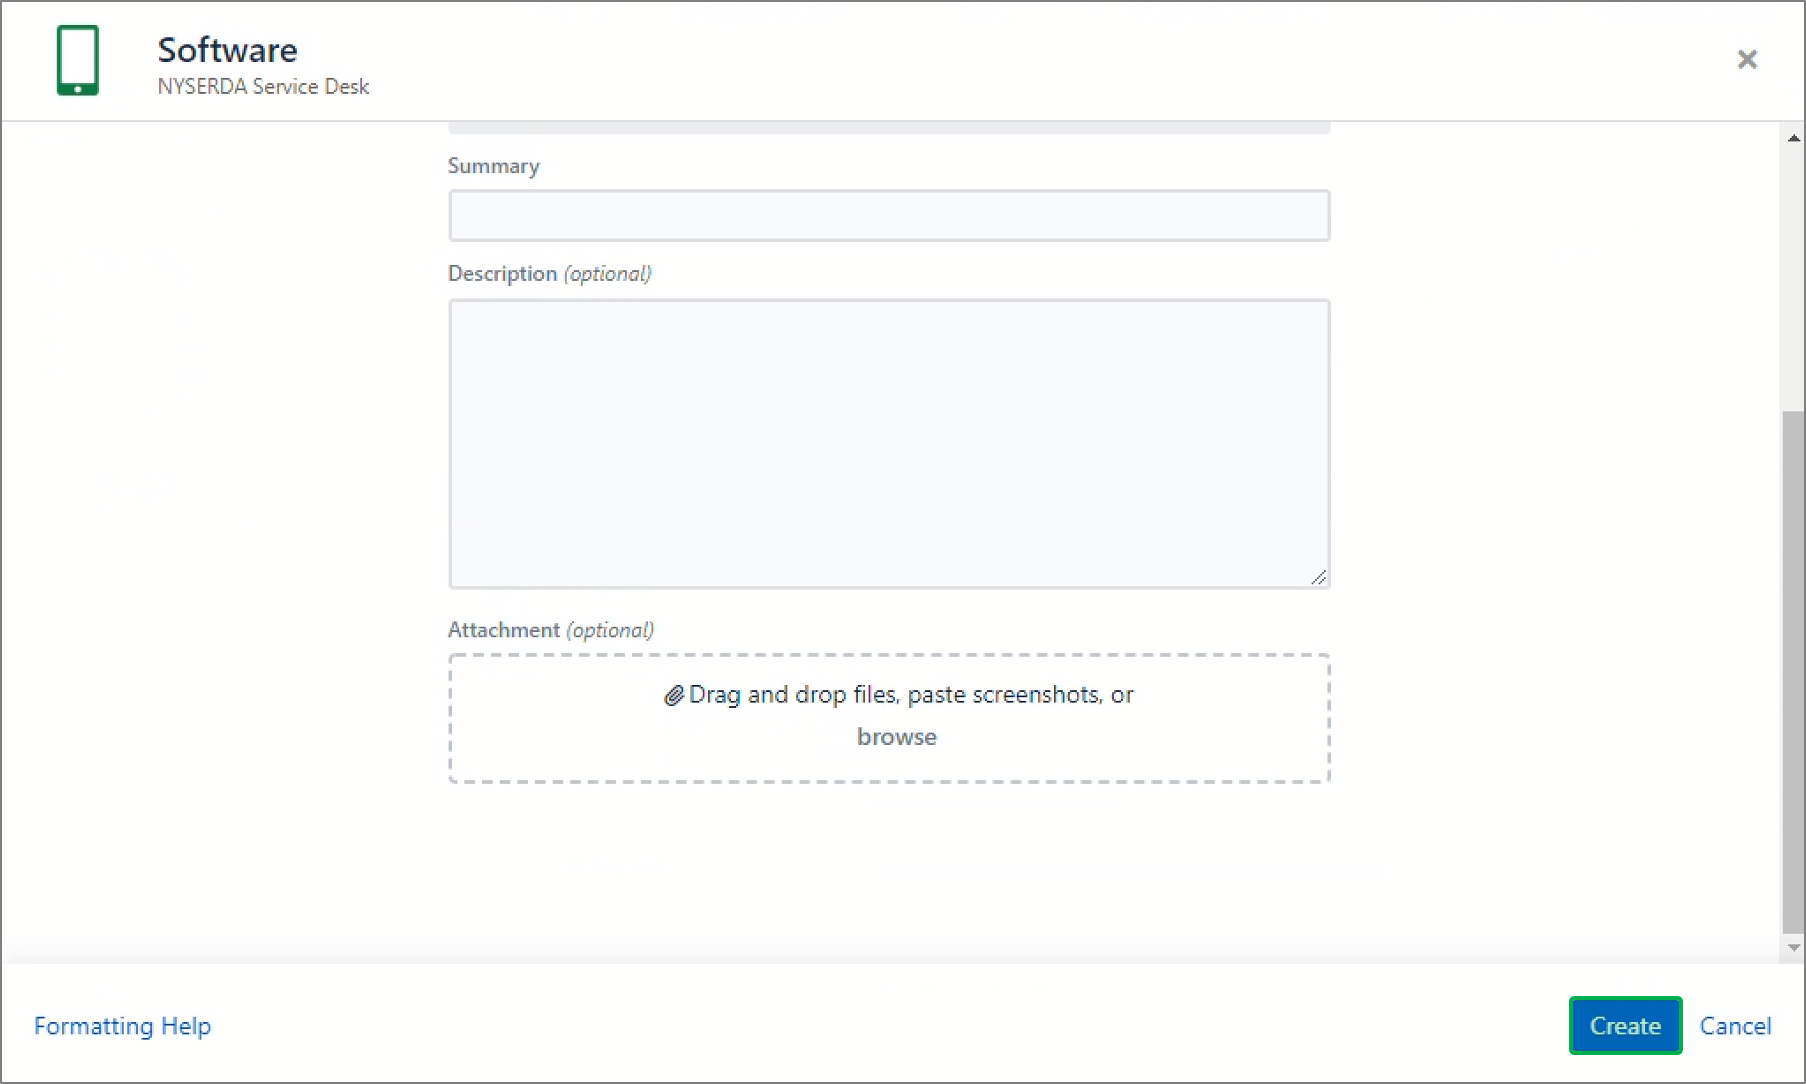
Click Create at the bottom when complete to submit the ticket.


Click on Service Desk (IT & Facilitaties) panel through the NYSERDA Launch Page.


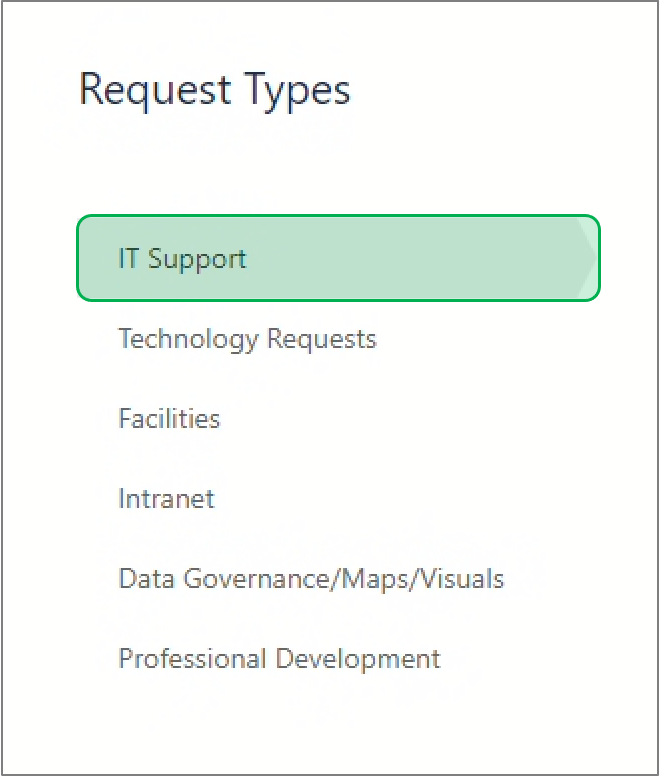
Scroll down on the page and click on the IT Support tab on the left.


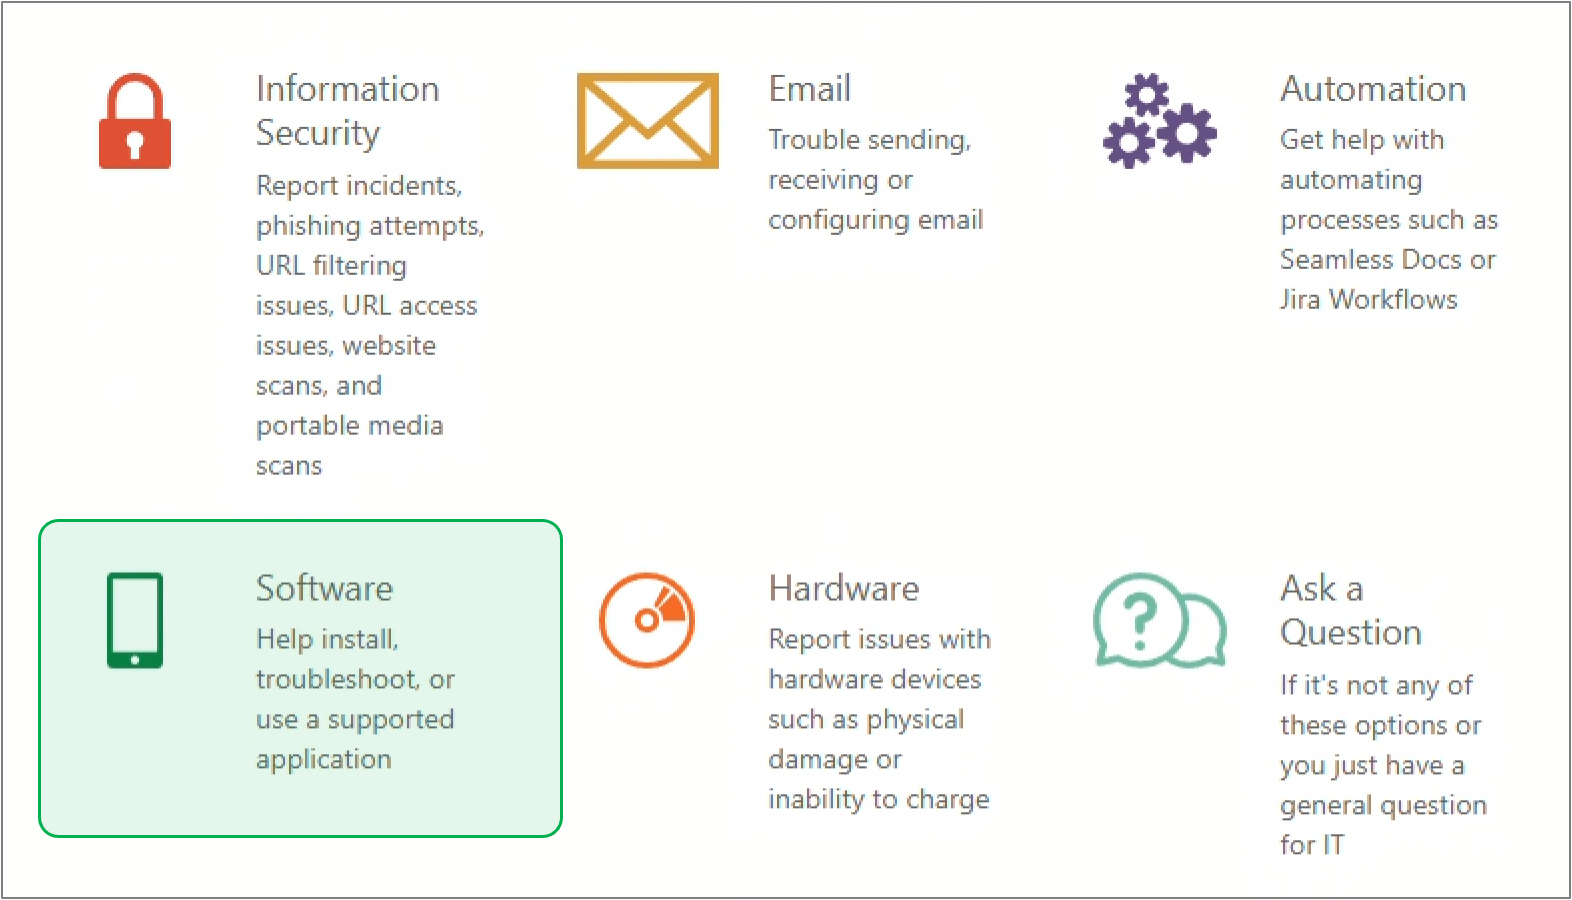
Within the IT Support tab, select the Software Ticket Type.


Click Create at the bottom when complete to submit the ticket.


Tableau has a compilation of video tutorials, practical training, and documentation that users may use to better understand how to navigate through different Tableau functions. These are accessible through the Learning tab on the Tableau website, tableau.com. (This is a direct link to the Tableau website, NOT the Tableau Application.)


In addition to the Knowledge Base, you can access more Tableau Training by going to dataplusscience.com and accessing the Tableau Reference Guide in the Learn More section.


<style type="text/css">
.aura-header {
padding-top: 10px!important;
padding-left: 10px!important;
padding-right: 10px!important;
}
.aura-headline {
padding-bottom: 10px!important;
}
.aura-body {
padding-left: 5px!important;
padding-right: 5px!important;
padding-top: 5px!important;
padding-bottom: 5px!important;
}
#system-content-items, #content-metadata-attachments { display: none; }
.aui-nav-imagelink {
display: none!important;
}
</style>

<script>
AJS.toInit(function() {
AJS.$('.page-metadata').hide();
});
</script>