Versions Compared

Key

  • This line was added.
  • This line was removed.
  • Formatting was changed.
Aura - Title
color#0073a4
textAlignleft
fontSize28
lineHeight28
cloudTextDemo Title
tagh1
fontWeightbold
Tableau

Aura - Divider
serializedStyles{"alignment":{"horizontal":"start"},"icon":{"name":"faPaperPlane","color":"#333","size":24},"text":{"color":"#333","fontSize":14,"textAlign":"left","fontWeight":"bold","text":"Aura Divider"},"border":{"top":false,"right":false,"bottom":true,"left":false,"color":"#0073a4","style":"solid","width":2},"size":{}}
typeregular

Info
iconfalse

The Tableaus workspace is a powerful and fast growing data visualization tool. Tableau simplifies raw data into easily understandable visual formats. Users can analyze data and create various forms of dashboards and worksheets quickly and easily. With its easy navigation and configuration tools. Tableau allows users to visualize all their data in one central location.

Expand
titleLaunch Tableau
UI Steps
sizesmall
UI Step

Select the Tableau Reporting and Self-Service  Tab from the bottom of the NYSERDA Launch page.

Expand
titlescreenshot

Image Added

UI Step

One the next screen, select either Production or Self-Service.

Expand
titlescreenshot

Image Added

Production


The Production environment in Tableau gives users view/read-only access to all if its visualizations. Users can filter workbooks and visualizations to create specific views, which they can save for later use. However, users cannot edit the data or visualizations beyond setting filters.

Users can access a project report/workbook or dashboard directly through Tableau (as shown in Tableau) or through Dashboard Central which can also be found on the Launch Page. Once a user chooses and enters a dashboard, they can switch between different tabs of the workbook, similar to how users can switch between tabs on an Excel Workbook.

Expand
titlescreenshot

Image Added


Self-Service

All users have web-edit access through the Self-Serving environment, where they can edit Tableau data and visualizations however they need and save them locally without affecting the original Tableau articles. To visualize data in different formats, click on Show Me and it proposes different types of visuals for the data.

UI Step

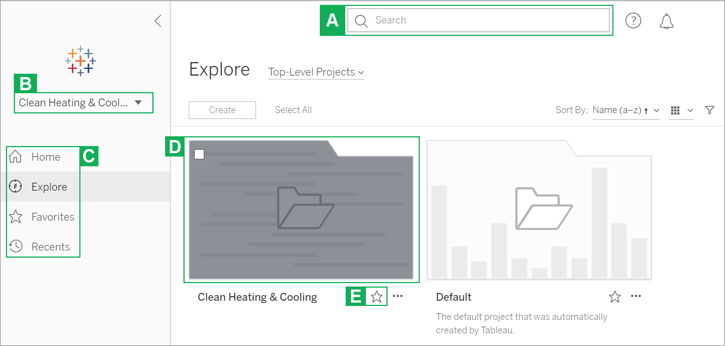
Regardless of which option you choose, you'll be brought to Tableau's home page.

Expand
titlescreenshot

Image Added

Letter

Function

Description

A

Search

Use the search engine to locate reports and sites within Tableau.

B

Site Selection

If you selected the wrong site when logging into Tableau Production, you can use this drop-down to navigate to other Tableau sites.

C

Controls

Use these controls to navigate between different Tableau views.

D

Report Folders

The folders shown in this section contain the varied reports and views stored in each Tableau site.

E

Favorite

Clicking this icon below any report folder or view will save the access link in your Favorites control option in the left hand navigation pane for easier access in the future.

Aura - Tab Group
settings{"generalSettings":{"tabSpacing":0,"tabWidth":100,"tabHeight":40,"direction":"horizontal"},"activeSettings":{"backgroundColor":{"color":"#002d72"},"text":{"fontSize":18,"color":"#fff","textAlign":"left","fontWeight":"normal"}},"inactiveSettings":{"backgroundColor":{"color":"#f4f5f7"},"text":{"fontSize":18,"color":"#5e6c84","textAlign":"left","fontWeight":"normal"}},"contentSettings":{"backgroundColor":{"color":"#fff"},"boxShadow":{"shadows":[{"color":"rgba(0, 0, 0, 0.08)","is":"drop-shadow","x":0,"y":0,"blur":1,"spread":0},{"color":"rgba(0, 0, 0, 0.16)","x":0,"y":3,"blur":2,"spread":-2}]},"border":{"style":"solid","width":2,"top":true,"bottom":false,"left":false,"right":false,"color":"#002d72"},"padding":{"top":10,"right":10,"bottom":10,"left":10}},"hoverSettings":{"backgroundColor":{"color":"#0073a4"},"text":{"fontSize":18,"color":"#ffffff","textAlign":"left","fontWeight":"normal"}}}
tab1
Aura - Tab
titleRelated Materials

UI Children
displayblock

Aura - Tab
titleRequest Support
Info
iconfalse

Tableau general users have read-only access to all dashboards and visualizations. Users can otherwise edit data as needed without making any changes to original visualizations in the Self-Service environment, which is a sandbox for further data analysis. 

To access certain functionalities, detailed below, users must submit an IT Service Request Ticket to gain the correct permissions and software for the use-case.

Aura - Panel
tab1
styles{"body":{"text":{"color":"#002d72","textAlign":"left","fontWeight":"normal","fontSize":14}},"header":{"backgroundColor":{"color":"#f3f4f9"}},"headline":{"alignment":{"horizontal":"start"},"text":{"text":"Creating New Datasets and/or Dashboards in Tableau","color":"#002d72","textAlign":"left","fontWeight":"bold","fontSize":18}},"base":{"backgroundColor":{"color":"#ffffff"},"borderRadius":{"radius":4},"boxShadow":{"shadows":[{"color":"rgba(0, 0, 0, 0.08)","x":0,"y":1,"blur":1,"spread":0},{"color":"rgba(0, 0, 0, 0.16)","x":0,"y":1,"blur":3,"spread":1}]}}}
body<p><br /></p>


Expand
titlelearn more...


Info
iconfalse

A user is encouraged to use the

UI Button
colorblue
sizesmall
titleDashboard Requirements
urlhttps://knowledge.nyserda.ny.gov/download/attachments/59605501/Dashboard%20Requirements%20Template.docx?api=v2
template as a resource to think about the common questions and the different features Tableau has, to help clarify the requirements needed for the Data Maps and Visualizations Team to generate the dashboard. 

You should expect the Data Maps and Visualizations Team to reach out to schedule a discovery conversation upon submitting the ticket.


UI Steps
sizesmall


UI Step

Click on Service Desk (IT & Facilities) panel through the NYSERDA Launch Page.

UI Step

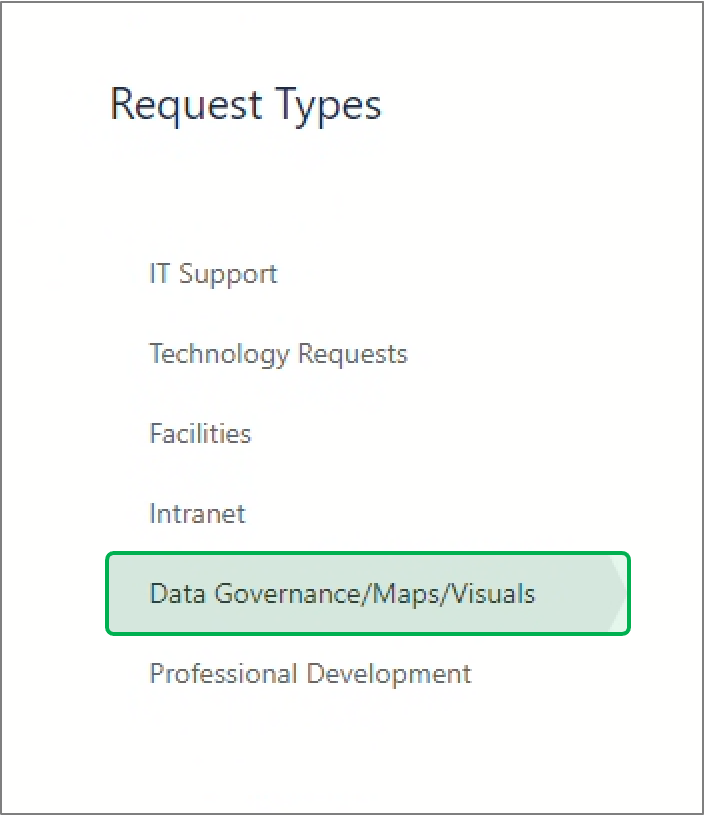
Scroll down on the page and click on the Data Governance/Maps/Visuals tab on the left.

Expand
titlescreenshot

Image Added

UI Step

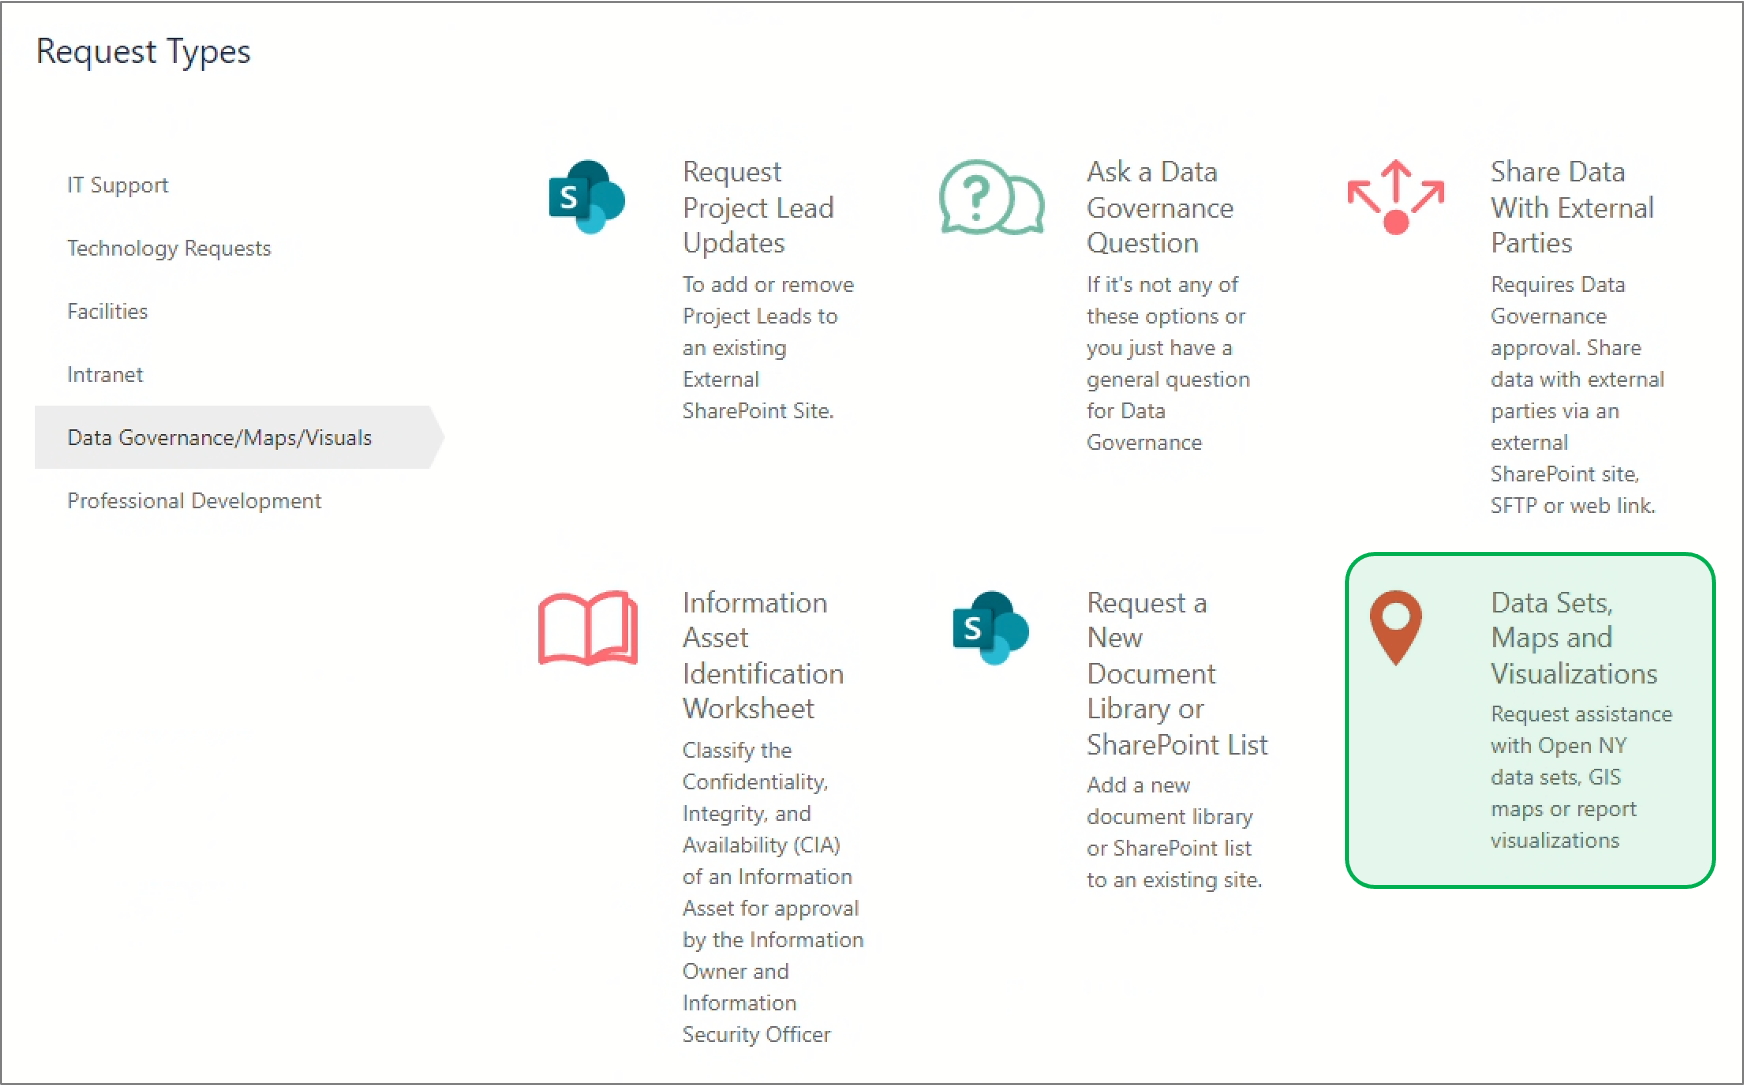
Within the Data Governance/Maps/Visuals tab, select the Data Sets, Maps and Visualizations ticket type.

Expand
titlescreenshot

Image Added

UI Step

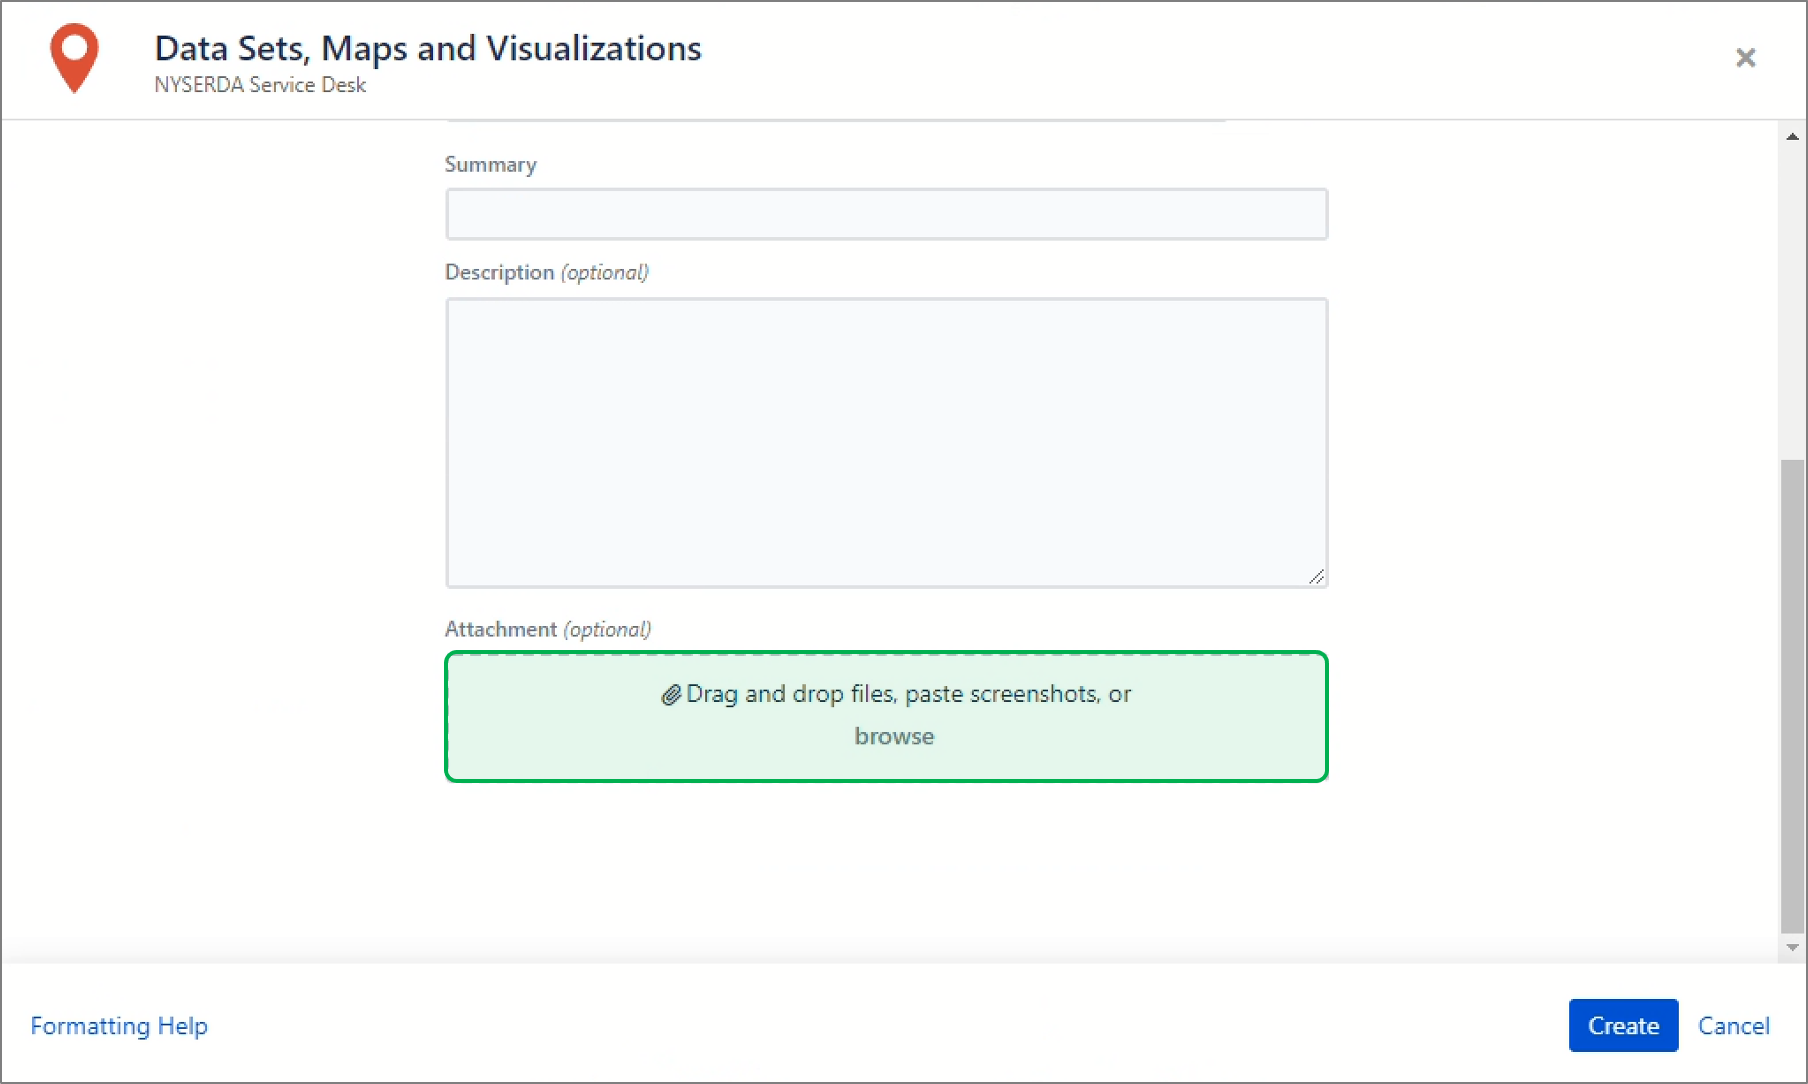
If the Dashboard Requirement Template was leveraged, drag and drop the template within the Attachment box.

Expand
titlescreenshot

Image Added

UI Step

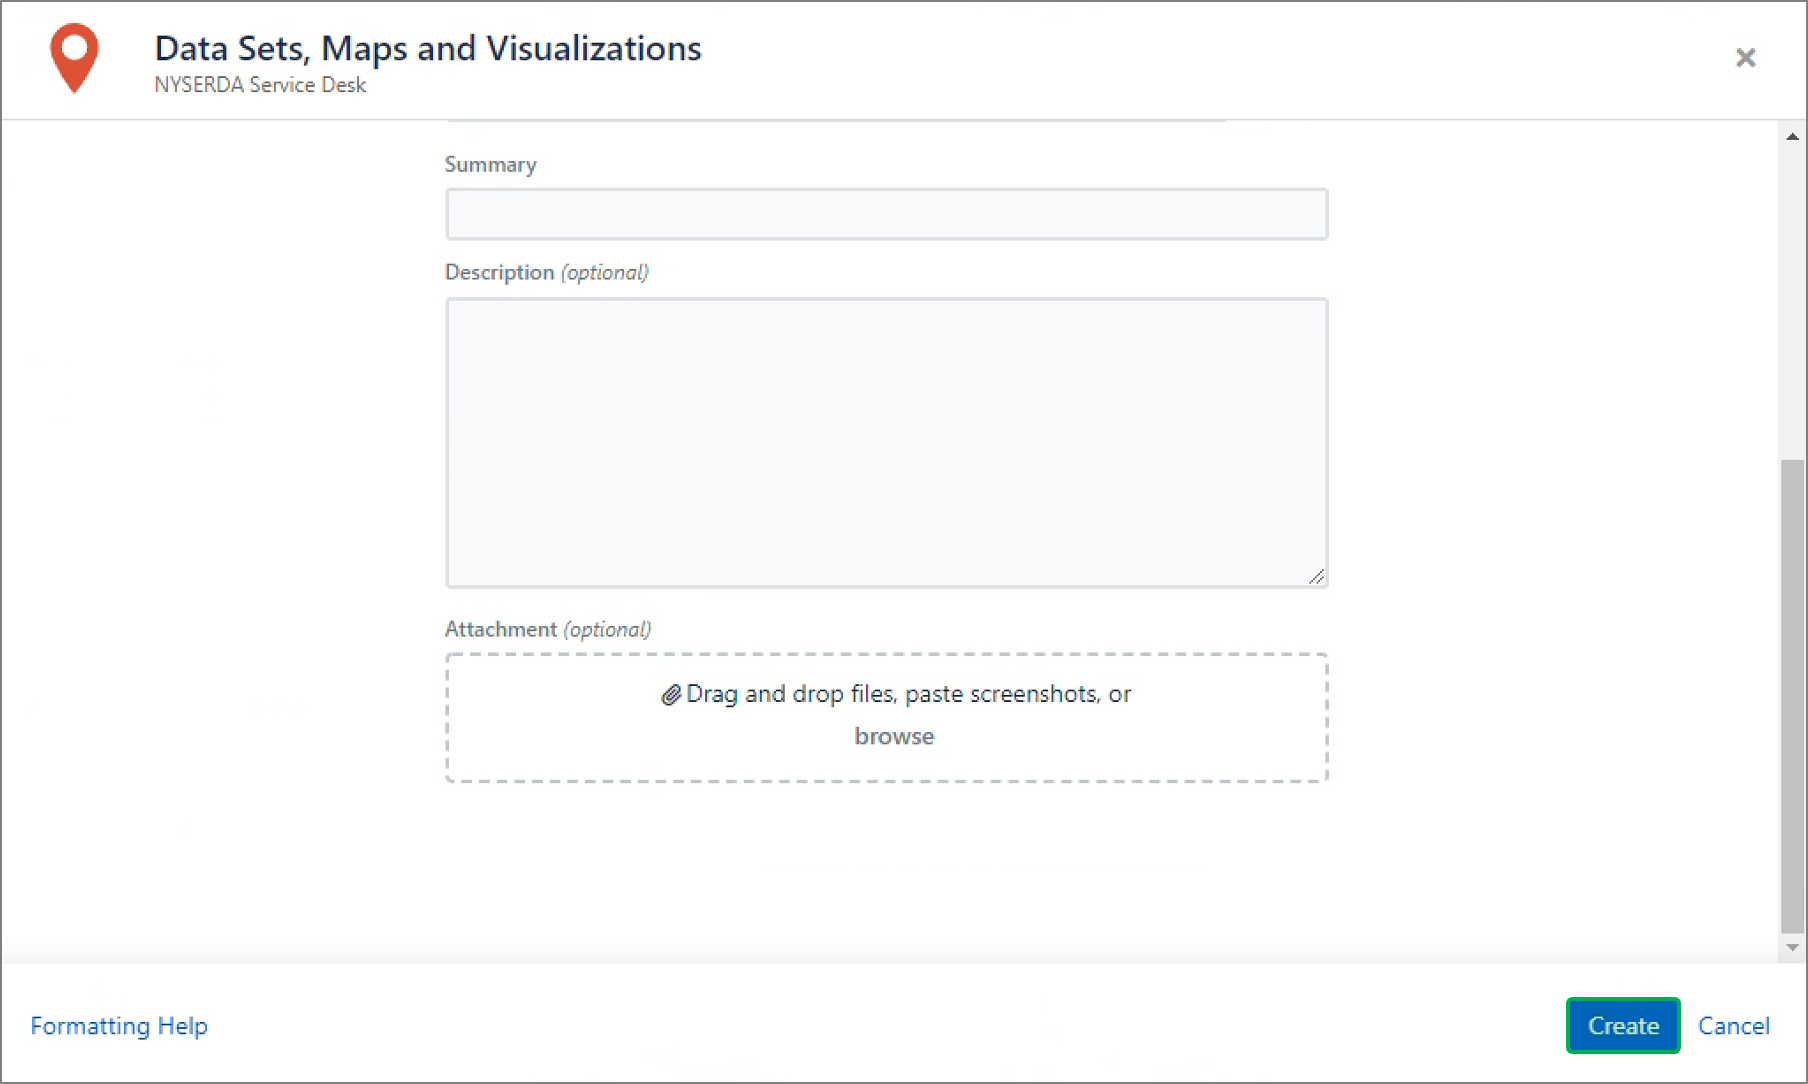
Click Create at the bottom when complete to submit the ticket.

Expand
titlescreenshot

Image Added


Aura - Panel
tab1
styles{"body":{"text":{"color":"#002d72","textAlign":"left","fontWeight":"normal","fontSize":14}},"header":{"backgroundColor":{"color":"#f3f4f9"}},"headline":{"alignment":{"horizontal":"start"},"text":{"text":"Request Tableau Desktop Software Access","color":"#002d72","textAlign":"left","fontWeight":"bold","fontSize":18}},"base":{"backgroundColor":{"color":"#ffffff"},"borderRadius":{"radius":4},"boxShadow":{"shadows":[{"color":"rgba(0, 0, 0, 0.08)","x":0,"y":1,"blur":1,"spread":0},{"color":"rgba(0, 0, 0, 0.16)","x":0,"y":1,"blur":3,"spread":1}]}}}
body<p><br /></p>


Expand
titlelearn more...


UI Steps
sizesmall


UI Step

Click on Service Desk (IT & Facilitaties) panel through the NYSERDA Launch Page.


UI Step

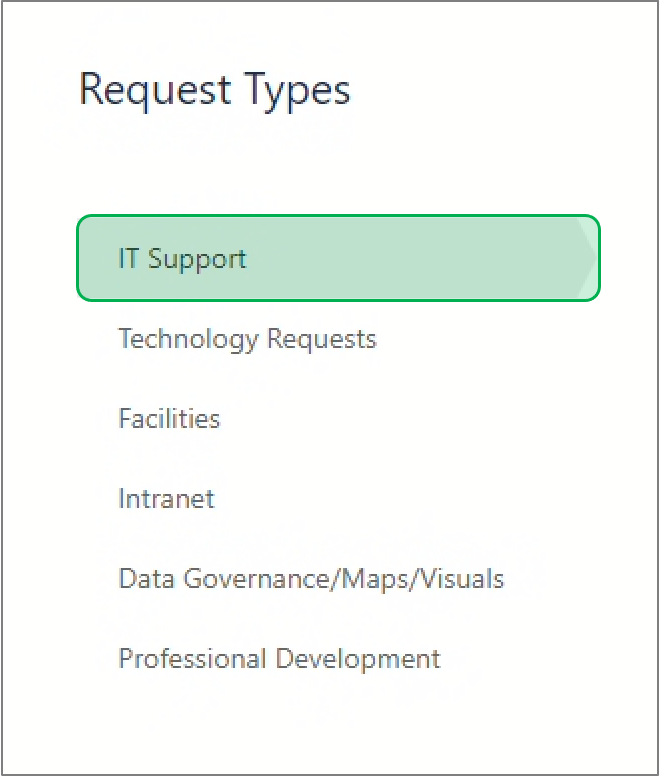
Scroll down on the page and click on the IT Support tab on the left.

Expand
titlescreenshot

Image Added


UI Step

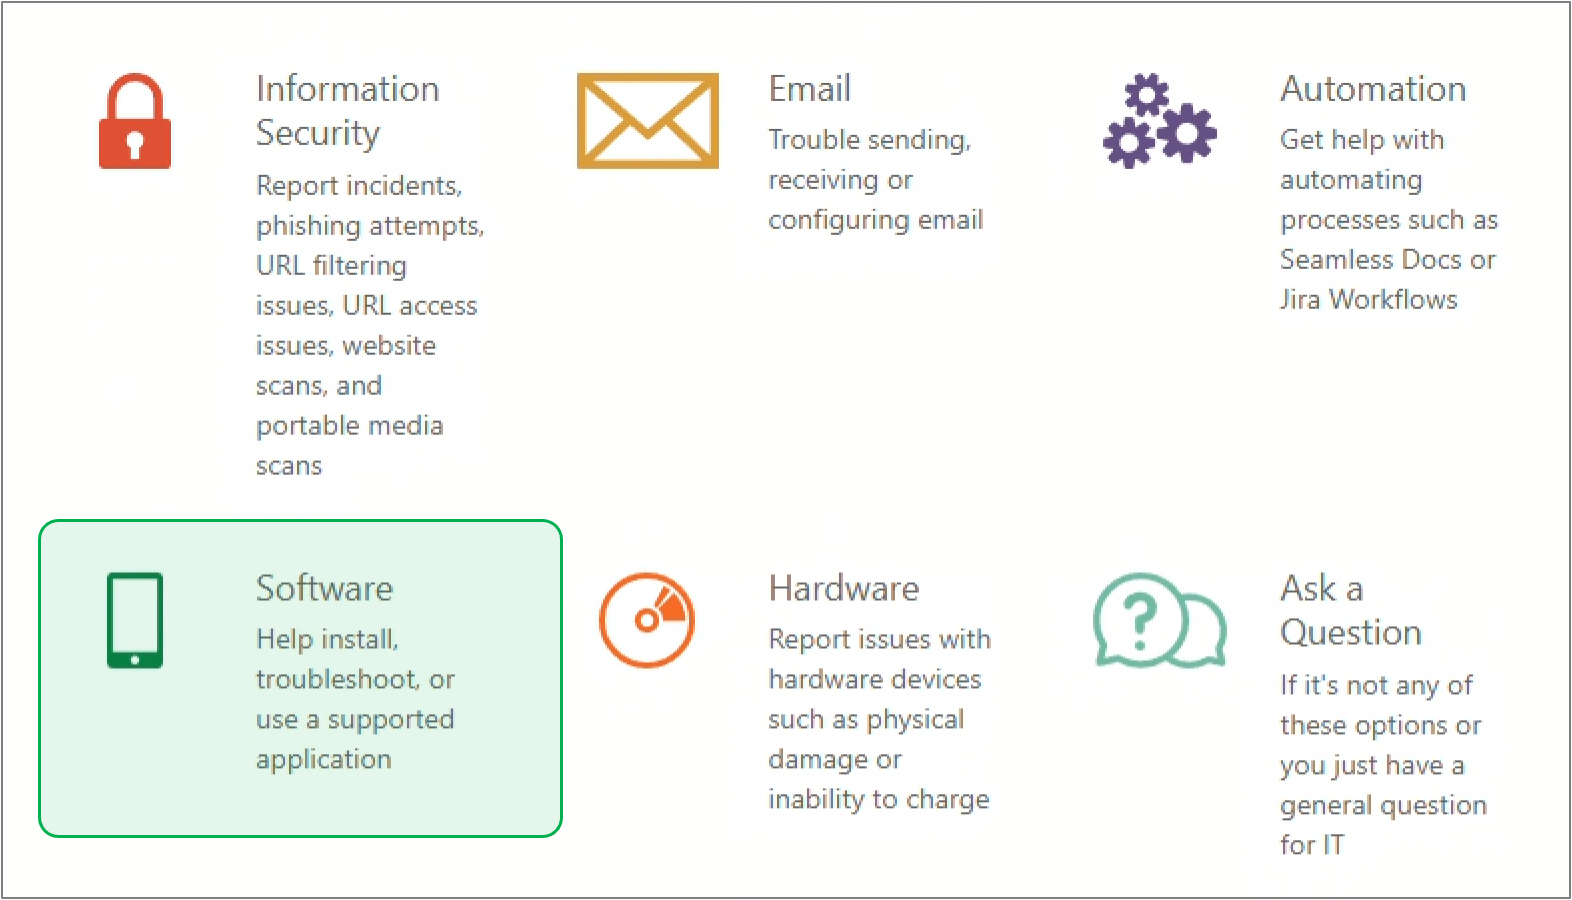
Within the IT Support tab, select the Software Ticket Type.

Expand
titlescreenshot

Image Added


UI Step

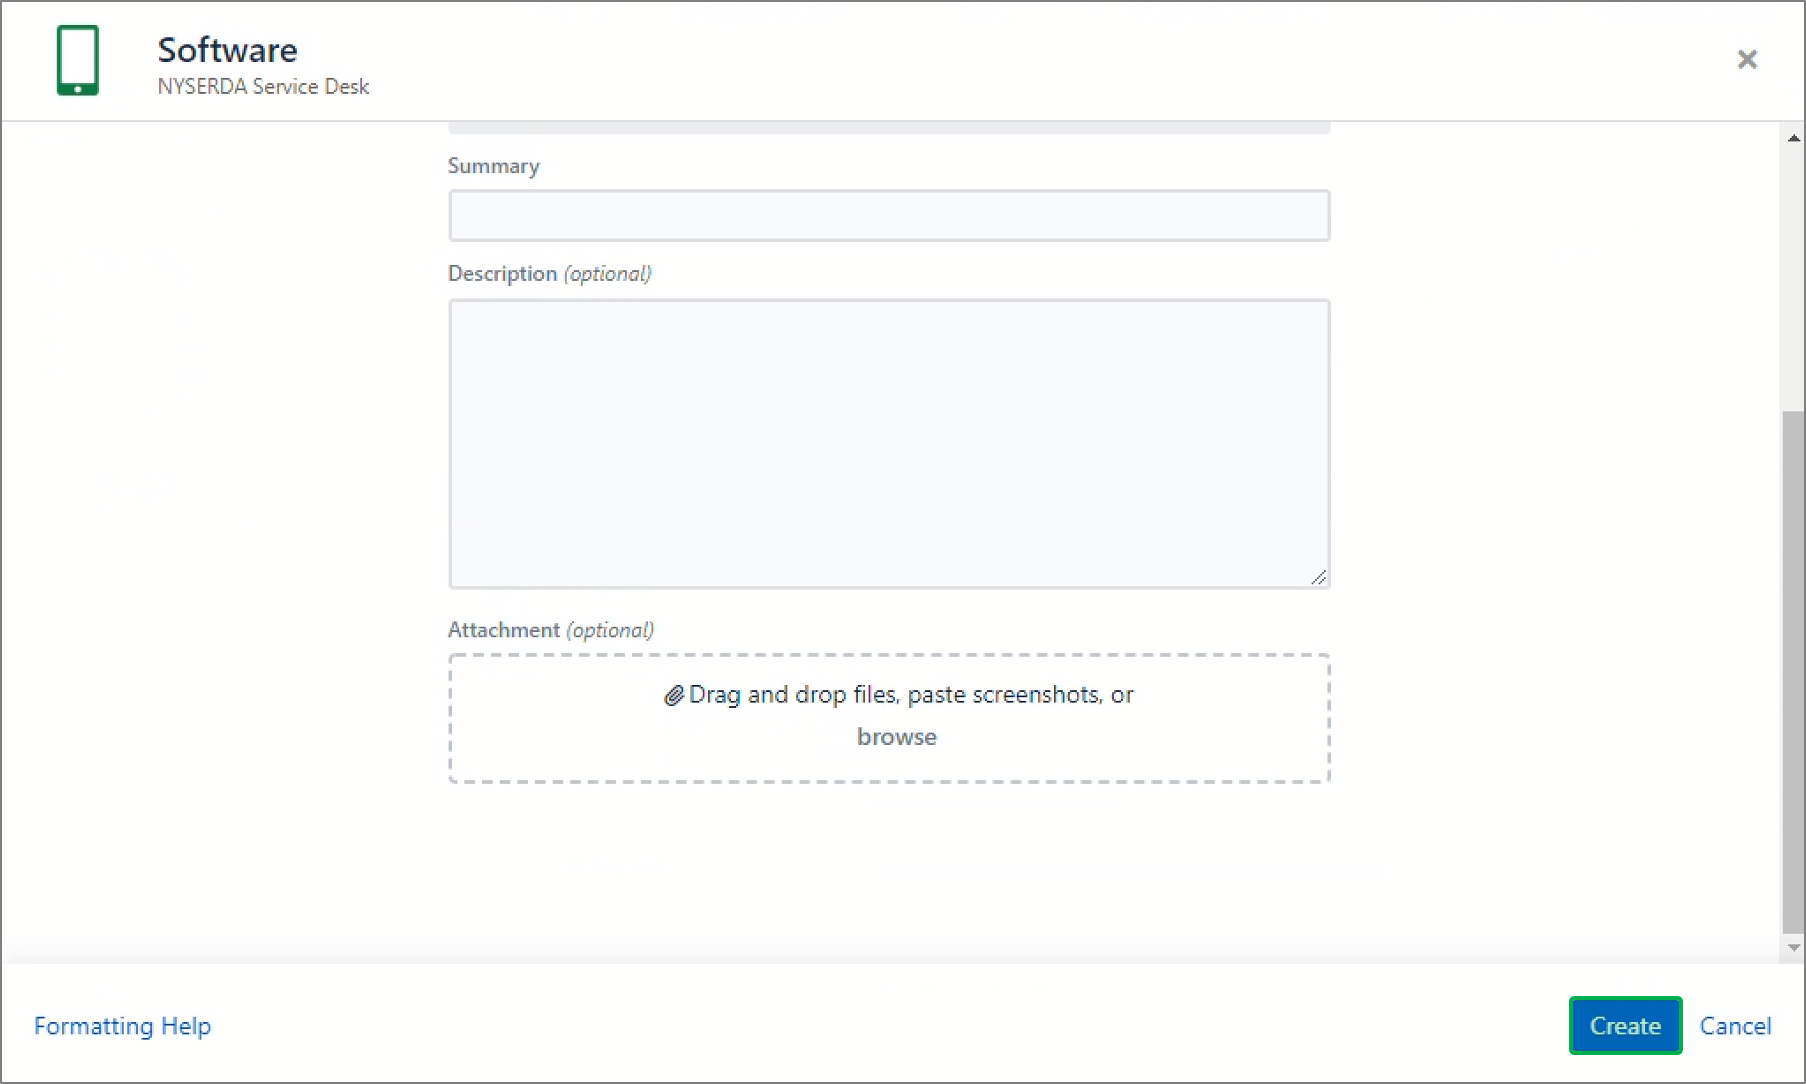
Click Create at the bottom when complete to submit the ticket.

Expand
titlescreenshot

Image Added


Aura - Tab
titleAdditional Resources


Aura - Panel
tab1
styles{"body":{"text":{"color":"#002d72","textAlign":"left","fontWeight":"normal","fontSize":14}},"header":{"backgroundColor":{"color":"#f3f4f9"}},"headline":{"alignment":{"horizontal":"start"},"text":{"text":"Tableau Learning","color":"#002d72","textAlign":"left","fontWeight":"bold","fontSize":18}},"base":{"backgroundColor":{"color":"#ffffff"},"borderRadius":{"radius":4},"boxShadow":{"shadows":[{"color":"rgba(0, 0, 0, 0.08)","x":0,"y":1,"blur":1,"spread":0},{"color":"rgba(0, 0, 0, 0.16)","x":0,"y":1,"blur":3,"spread":1}]}}}
body<p><br /></p>

Tableau has a compilation of video tutorials, practical training, and documentation that users may use to better understand how to navigate through different Tableau functions. These are accessible through the Learning tab on the Tableau website, tableau.com. (This is a direct link to the Tableau website, NOT the Tableau Application.)


Aura - Panel
tab1
styles{"body":{"text":{"color":"#002d72","textAlign":"left","fontWeight":"normal","fontSize":14}},"header":{"backgroundColor":{"color":"#f3f4f9"}},"headline":{"alignment":{"horizontal":"start"},"text":{"text":"Data Plus Science Website","color":"#002d72","textAlign":"left","fontWeight":"bold","fontSize":18}},"base":{"backgroundColor":{"color":"#ffffff"},"borderRadius":{"radius":4},"boxShadow":{"shadows":[{"color":"rgba(0, 0, 0, 0.08)","x":0,"y":1,"blur":1,"spread":0},{"color":"rgba(0, 0, 0, 0.16)","x":0,"y":1,"blur":3,"spread":1}]}}}
body<p><br /></p>

In addition to the Knowledge Base, you can access more Tableau Training by going to dataplusscience.com and accessing the Tableau Reference Guide in the Learn More section.


HTML
<style type="text/css">
#title-text { display: none;}
</style>

Introduction to Tableau

The Tableau workspace consists of menus, a toolbar, the Data pane, cards and shelves, and one or more sheets. Sheets can be worksheets, dashboards, or stories. For details on dashboard or story workspaces, see Create a Dashboard or The Story Workspace. 

Workspace area

A. Workbook name. A workbook contains sheets. A sheet can be a worksheet, a dashboard, or a story. For more information, see Workbooks and Sheets.

B. Cards and shelves - Drag fields to the cards and shelves in the workspace to add data to your view.

C. Toolbar - Use the toolbar to access commands and analysis and navigation tools.

D. View - This is the canvas in the workspace where you create a visualization (also referred to as a "viz").

E. Click this icon to go to the Start page, where you can connect to data. For more information, see Start Page.

F. Side Bar - In a worksheet, the side bar area contains the Data pane and the Analytics pane.

G. Click this tab to go to the Data Source page and view your data. For more information, see Data Source Page.

H. Status bar - Displays information about the current view.

I. Sheet tabs - Tabs represent each sheet in your workbook. This can include worksheets, dashboards, and stories. For more information, see Workbooks and Sheets.

Expand
titlescreenshot

Image Removed

When you are creating or editing a view, you can use the toolbar at the top of the view to perform common actions.

In Tableau Desktop, you can hide or display the Tableau toolbar by selecting Window > Show Toolbar.

Show and Hide the Side Bar (Data pane)

The Side Bar contains the Data pane and the Analytics pane when you are editing a worksheet. Different panes are visible depending on what you are doing in the view (Data, Analytics, Story, Dashboard, Layout, Format). The most important thing to know about the Side Bar is that you can expand and collapse this area in the workspace.

Hide Side Bar in Tableau Desktop

  • Click the collapse arrow in the side bar.
Expand
titlescreenshot

Image Removed

Hide Side Bar on the Web 

  • Click the collapse arrow in the side bar.
Expand
titlescreenshot

Image Removed

Show Side Bar on Tableau Desktop 

  • Click the expand arrow in the bottom-left of the workspace (on the status bar).
Expand
titlescreenshot

Image Removed

Show Side Bar on the Web 

  • Click the expand arrow in the side bar.
Expand
titlescreenshot

Image Removed

Status Bar Information

The status bar is located at the bottom of the Tableau workspace. It displays descriptions of menu items as well as information about the current view. For example, the status bar below shows that the view has 143 marks shown in 3 rows and 12 columns. It also shows that the SUM(Sales) for all the marks in the view is $2,297,201.

Expand
titlescreenshot

Image Removed

You can hide the status bar by selecting Window > Show Status Bar.

Occasionally, Tableau will display warning icons in the bottom right corner of the status bar to indicate errors or warnings.

Tableau
Panel
borderColor#5f5f5f
bgColor#dfdfdf
titleColor#5f5f5f
borderStylesolid
titleRelated Content
Page Tree
root