| Info |
|---|
| This section reviews the Measures and Dimensions of Tableau. These allow users to quantitative and qualitative data variations from the source worksheet to create new dashboards. |
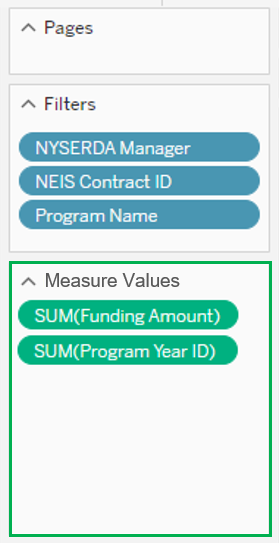
MeasuresMeasures are numeric, quantifiable fields you can use in your data to get aggregated values of the data. When you drag a measure into the view, Tableau applies an aggregation to that measure (by default). | Expand |
|---|
| 
|
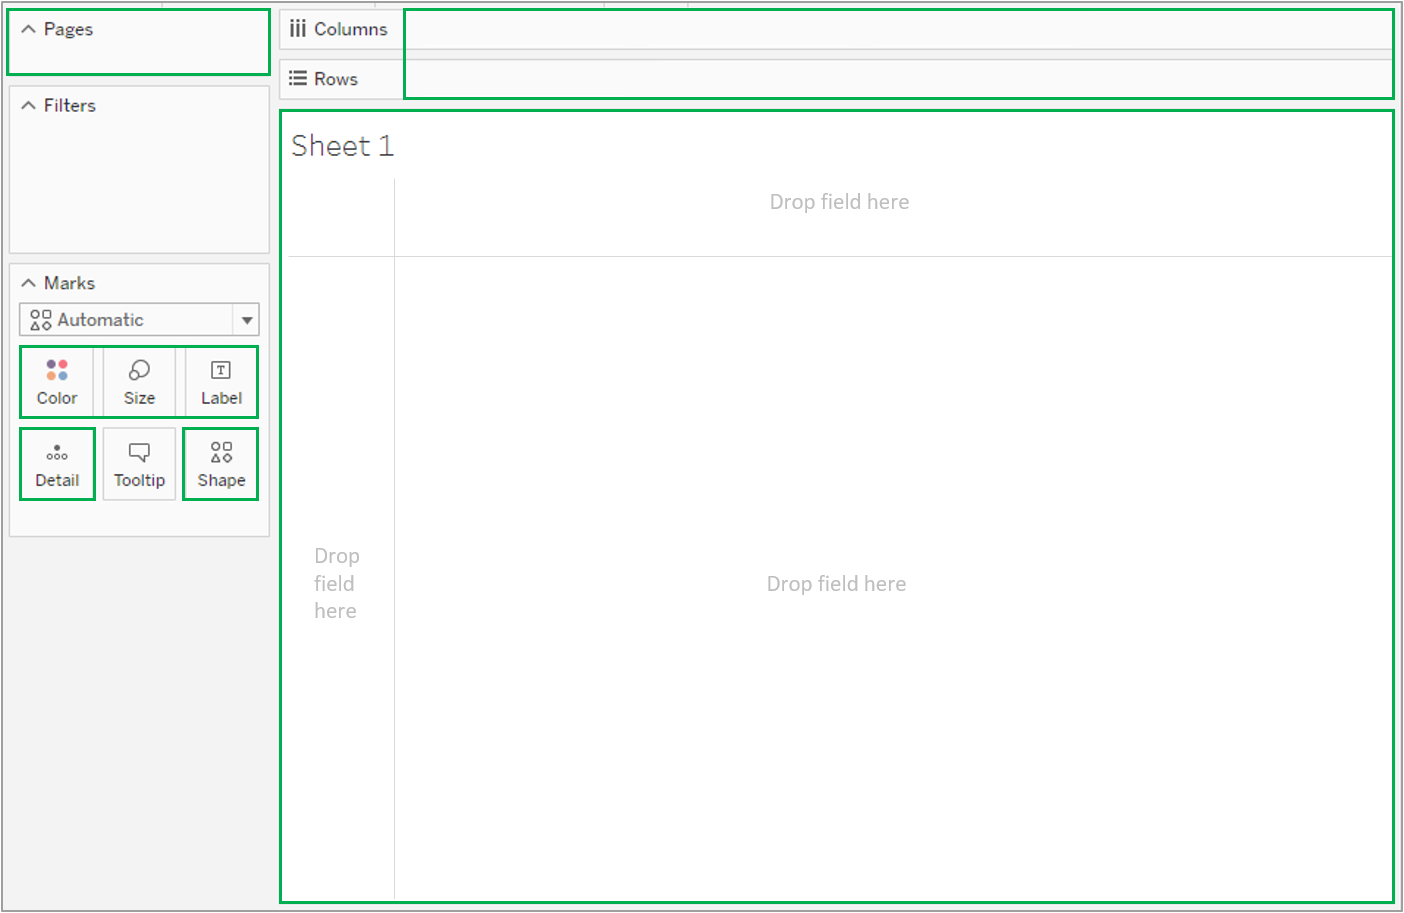
DimensionsDimensions contain qualitative values (such as names, dates, or geographical data). You can use dimensions to categorize, segment, and reveal the details in your data. Dimensions affect the level of detail in the view. Adding a Dimension to any of the following locations in Tableau affects the level of detail: | Expand |
|---|
| 
|
FAQ| Expand |
|---|
| title | How do I check to see if my Measures and Dimensions are assigned correctly? |
|---|
| Measure is something you can add, like a sum of sales. Dimension defines how a measure is broken up, like a region or section. Tableau auto assigns. Right click on a dimension – Convert to Measure, or right-click on a Measure and Convert to a dimension. Dates are dimensions. You must use a "=" sign next to the measure or dimension field in a calculated field. To create calculated field - Right click, Create, Calculated Field, the text turns orange when you have typed a field that is in your dataset. You can drag the field into the calculation window. You can do basic calculations like convert kW to MW, etc. Click the arrow on the right of the calculation window to see all the functions available. |
| Expand |
|---|
| title | How do I add Dimension columns to the tabular view? |
|---|
| Drag the dimensions onto the Rows shelf. Move around to reorder. You can add worksheets or dashboards. Tableau automatically creates a Measure Name as a dimension, Measure Values as a measure. To add measure to the tabular view, Drag measure names onto Filter – a filter on the side will appear. Click/select the measures of interest. Drag Measure Values onto the Text Shelf. Drag measure names onto Columns. To reorder the way the measures appear in the table, drag and reorder in the Measure Values box. To filter, drag field to filter box. The filter shows up as a box on the right, and you can select what you want to filter in or out. Right click on measure values or on individual measures to increase the decimal places to 6. Hard to filter out Nulls. Need to create calculated field or do in desktop. |
| 


