| Aura - Tab |
|---|
| title | NENY: Tableau Reports |
|---|
|
| Aura - Panel |
|---|
| tab | 1 |
|---|
| styles | {"body":{"text":{"color":"#002d72","textAlign":"left","fontWeight":"normal","fontSize":14}},"header":{"backgroundColor":{"color":"#f3f4f9"}},"headline":{"alignment":{"horizontal":"start"},"text":{"text":"General NENY Tableau Reports Information","color":"#002d72","textAlign":"left","fontWeight":"bold","fontSize":18}},"base":{"backgroundColor":{"color":"#ffffff"},"borderRadius":{"radius":4},"boxShadow":{"shadows":[{"color":"rgba(0, 0, 0, 0.08)","x":0,"y":1,"blur":1,"spread":0},{"color":"rgba(0, 0, 0, 0.16)","x":0,"y":1,"blur":3,"spread":1}]}}} |
|---|
| body | <p><br /></p> |
|---|
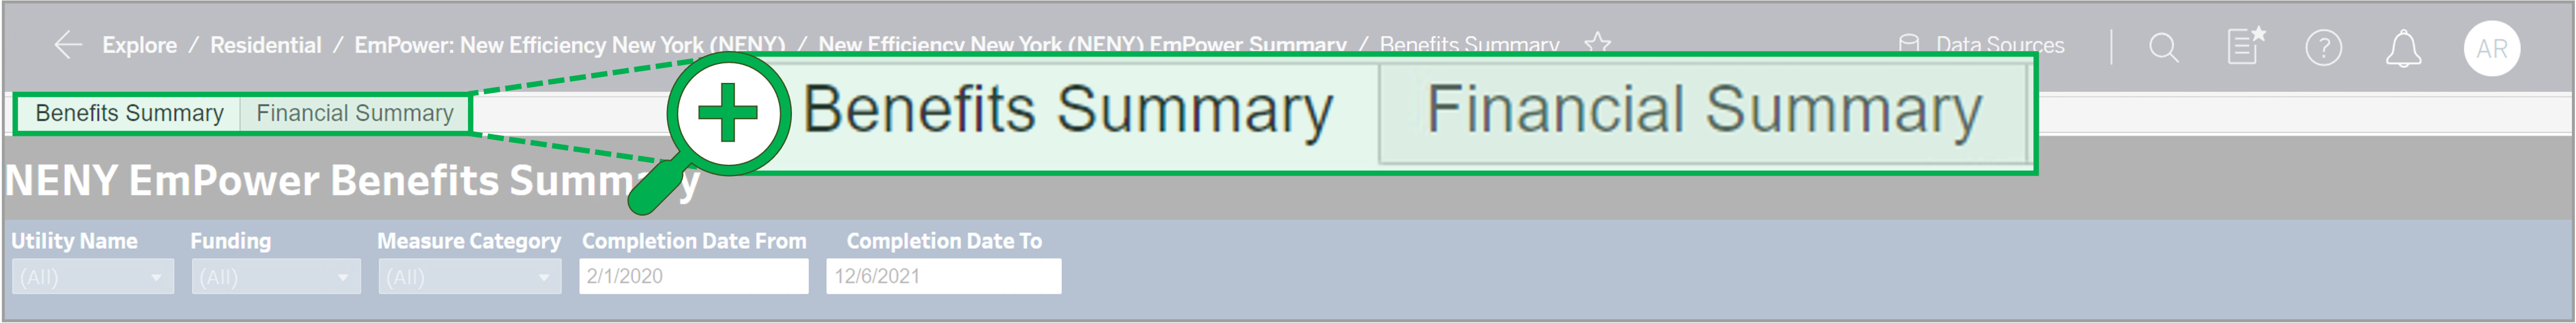
| The NENY Tableau Reports contain two separate reports available to Utility companies, the Benefits Summary and the Financial Summary, and are accessed from the tabs at the top of the report tableau site. Learn more about each of these two reports below. | Expand |
|---|
| title | how to access the report tabs... |
|---|
| 
|
|
| Aura - Panel |
|---|
| tab | 1 |
|---|
| styles | {"body":{"text":{"color":"#002d72","textAlign":"left","fontWeight":"normal","fontSize":14}},"header":{"backgroundColor":{"color":"#f3f4f9"}},"headline":{"alignment":{"horizontal":"start"},"text":{"text":"Benefits Summary Report","color":"#002d72","textAlign":"left","fontWeight":"bold","fontSize":18}},"base":{"backgroundColor":{"color":"#ffffff"},"borderRadius":{"radius":4},"boxShadow":{"shadows":[{"color":"rgba(0, 0, 0, 0.08)","x":0,"y":1,"blur":1,"spread":0},{"color":"rgba(0, 0, 0, 0.16)","x":0,"y":1,"blur":3,"spread":1}]}}} |
|---|
| body | <p><br /></p> |
|---|
| The Benefits Summary table is an overnight batch process that holds data from the Project Management Database for completed work. | Expand |
|---|
|
| Section |
|---|
| Column |
|---|
|
| UI Steps |
|---|
|
| UI Step |
|---|
This section of the report contains the report filters. Filters provide Utilities the ability to narrow down the report information. Filters cannot be saved. andwill need to be reset each time a Utility accesses the report. | Field Title | Field Description |
|---|
| Utility Name |
| | Funding |
| | Measure Category |
| | Completion Date From | Use to locate the earliest possible date for inclusion of data within the report. Utilities can only choose year, month, or a specific date. | | Completion Date To |
|
The filters allows Utility to further filter and look at specific measures. | Tip |
|---|
The Completion Date From filter allows user to chose only year, month, or specific date. The filter however, may not be saved. |
|
| UI Step |
|---|
Utility can see an overview of the funding at a high level to see where the New Efficiency NY funding is being used. |
| UI Step |
|---|
The Incentive Budgets information is pulled from NEIS(incentive only), it provides a snapshot of what the expenditures are for a particular utility. | Tip |
|---|
Even if the top part of the page is filtered, the Incentive Budgets table does not get filtered. |
|
|
|
| Column |
|---|
| 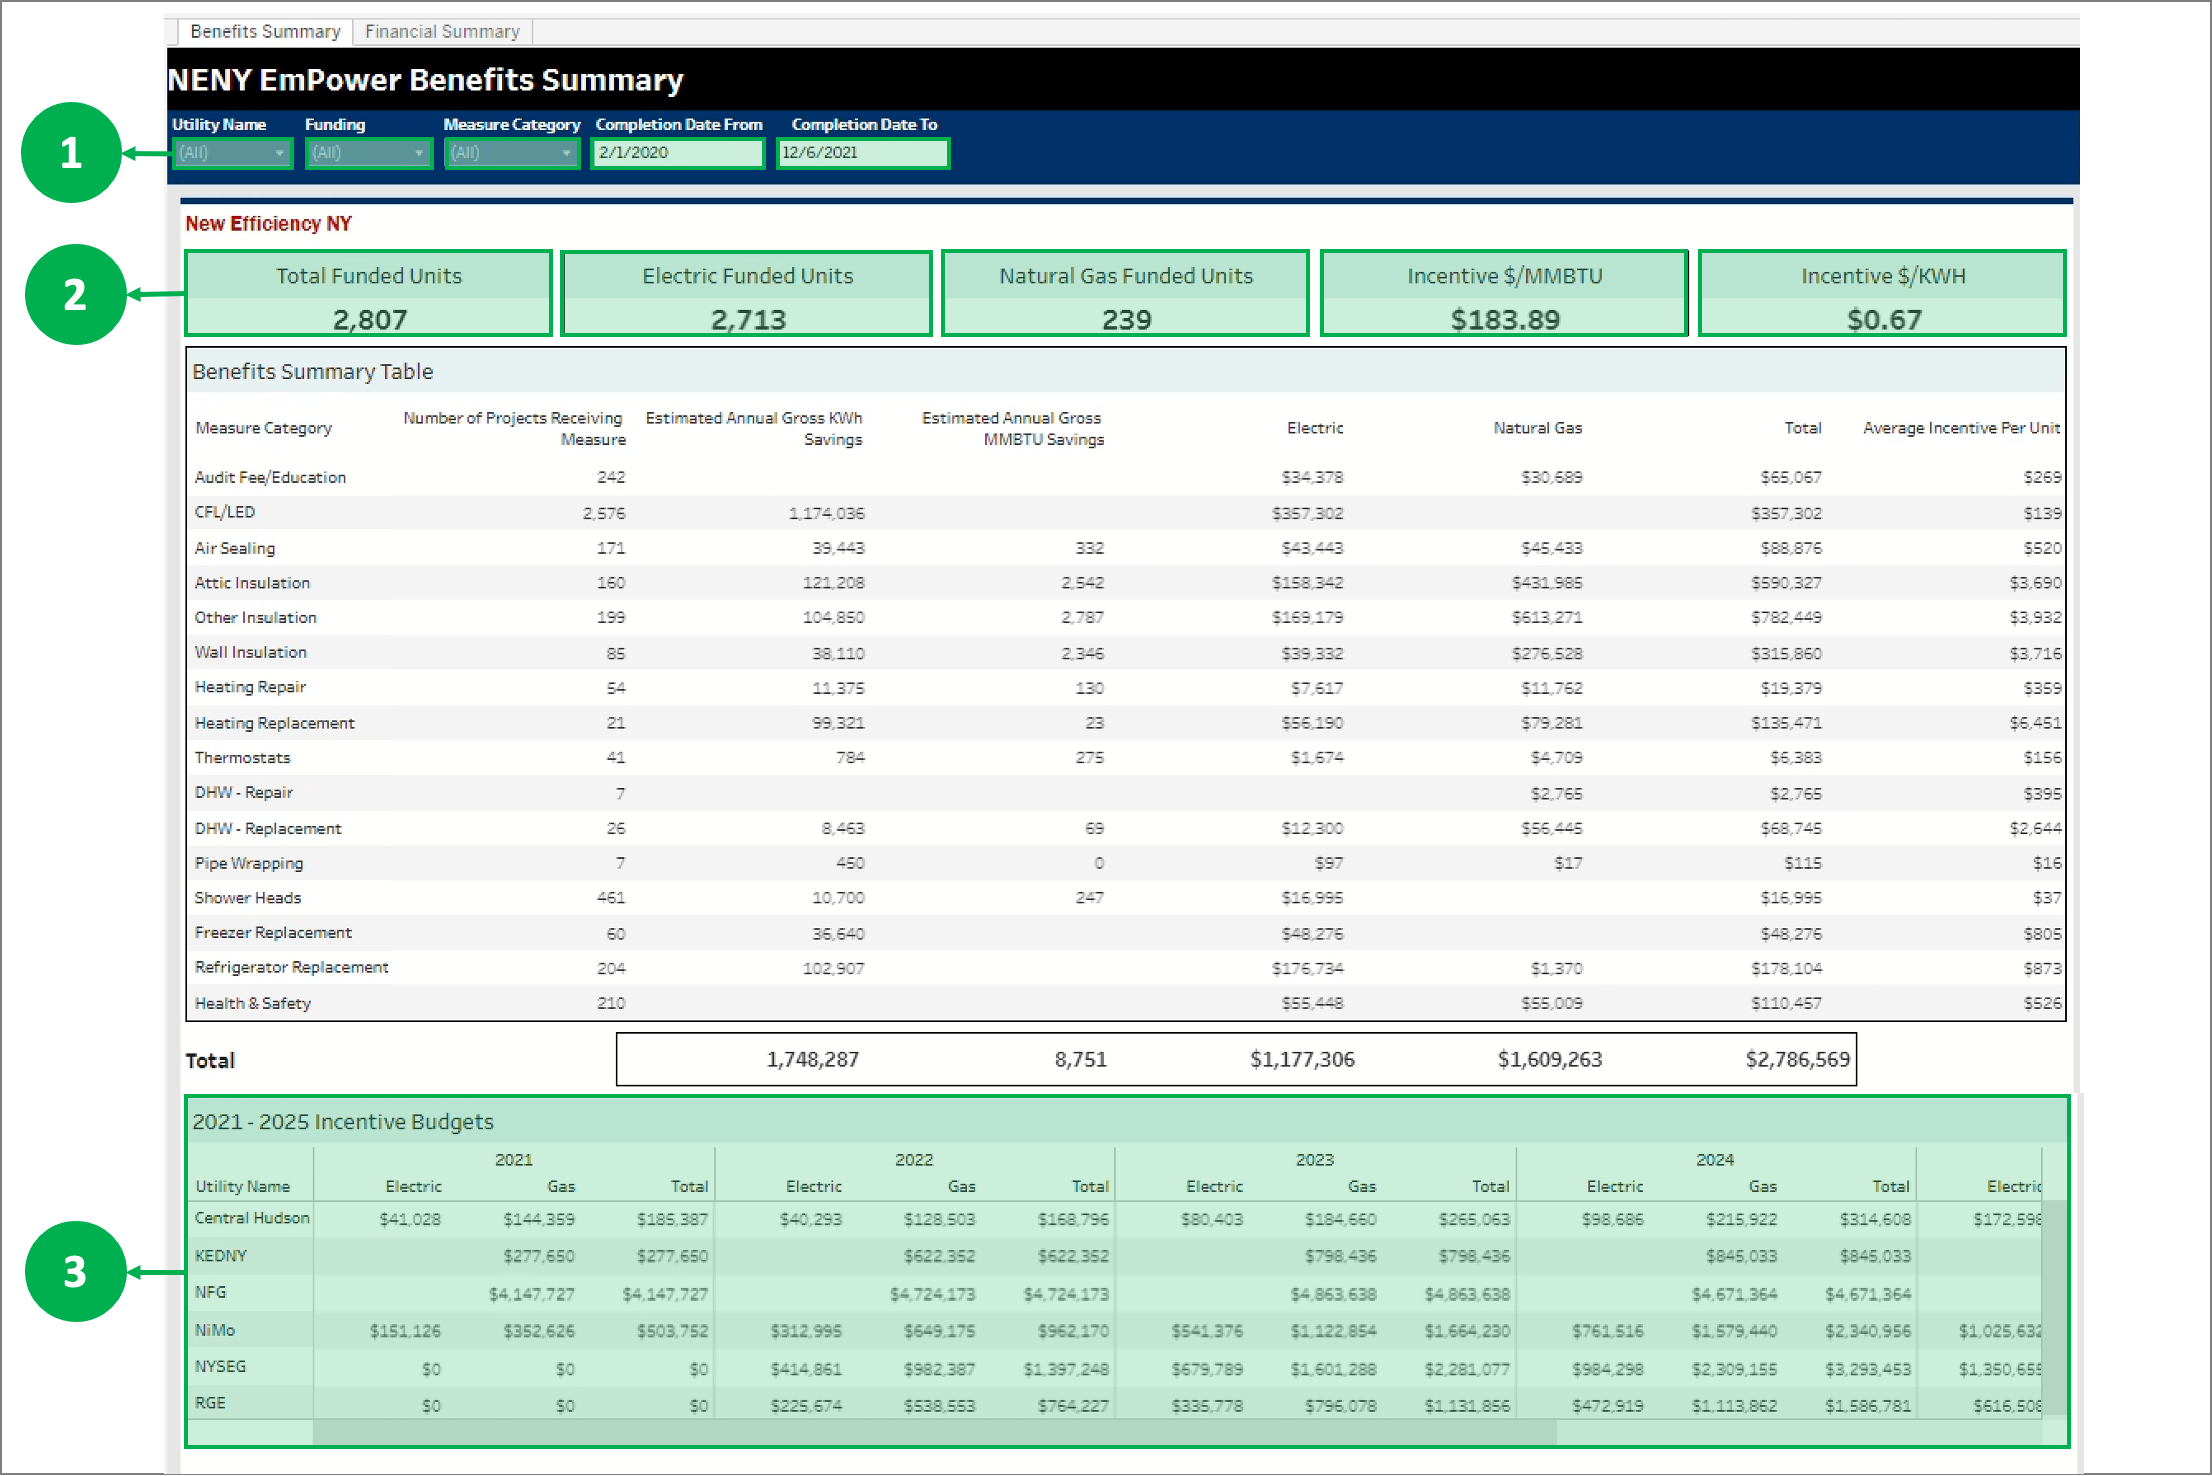 Image Removed Image Removed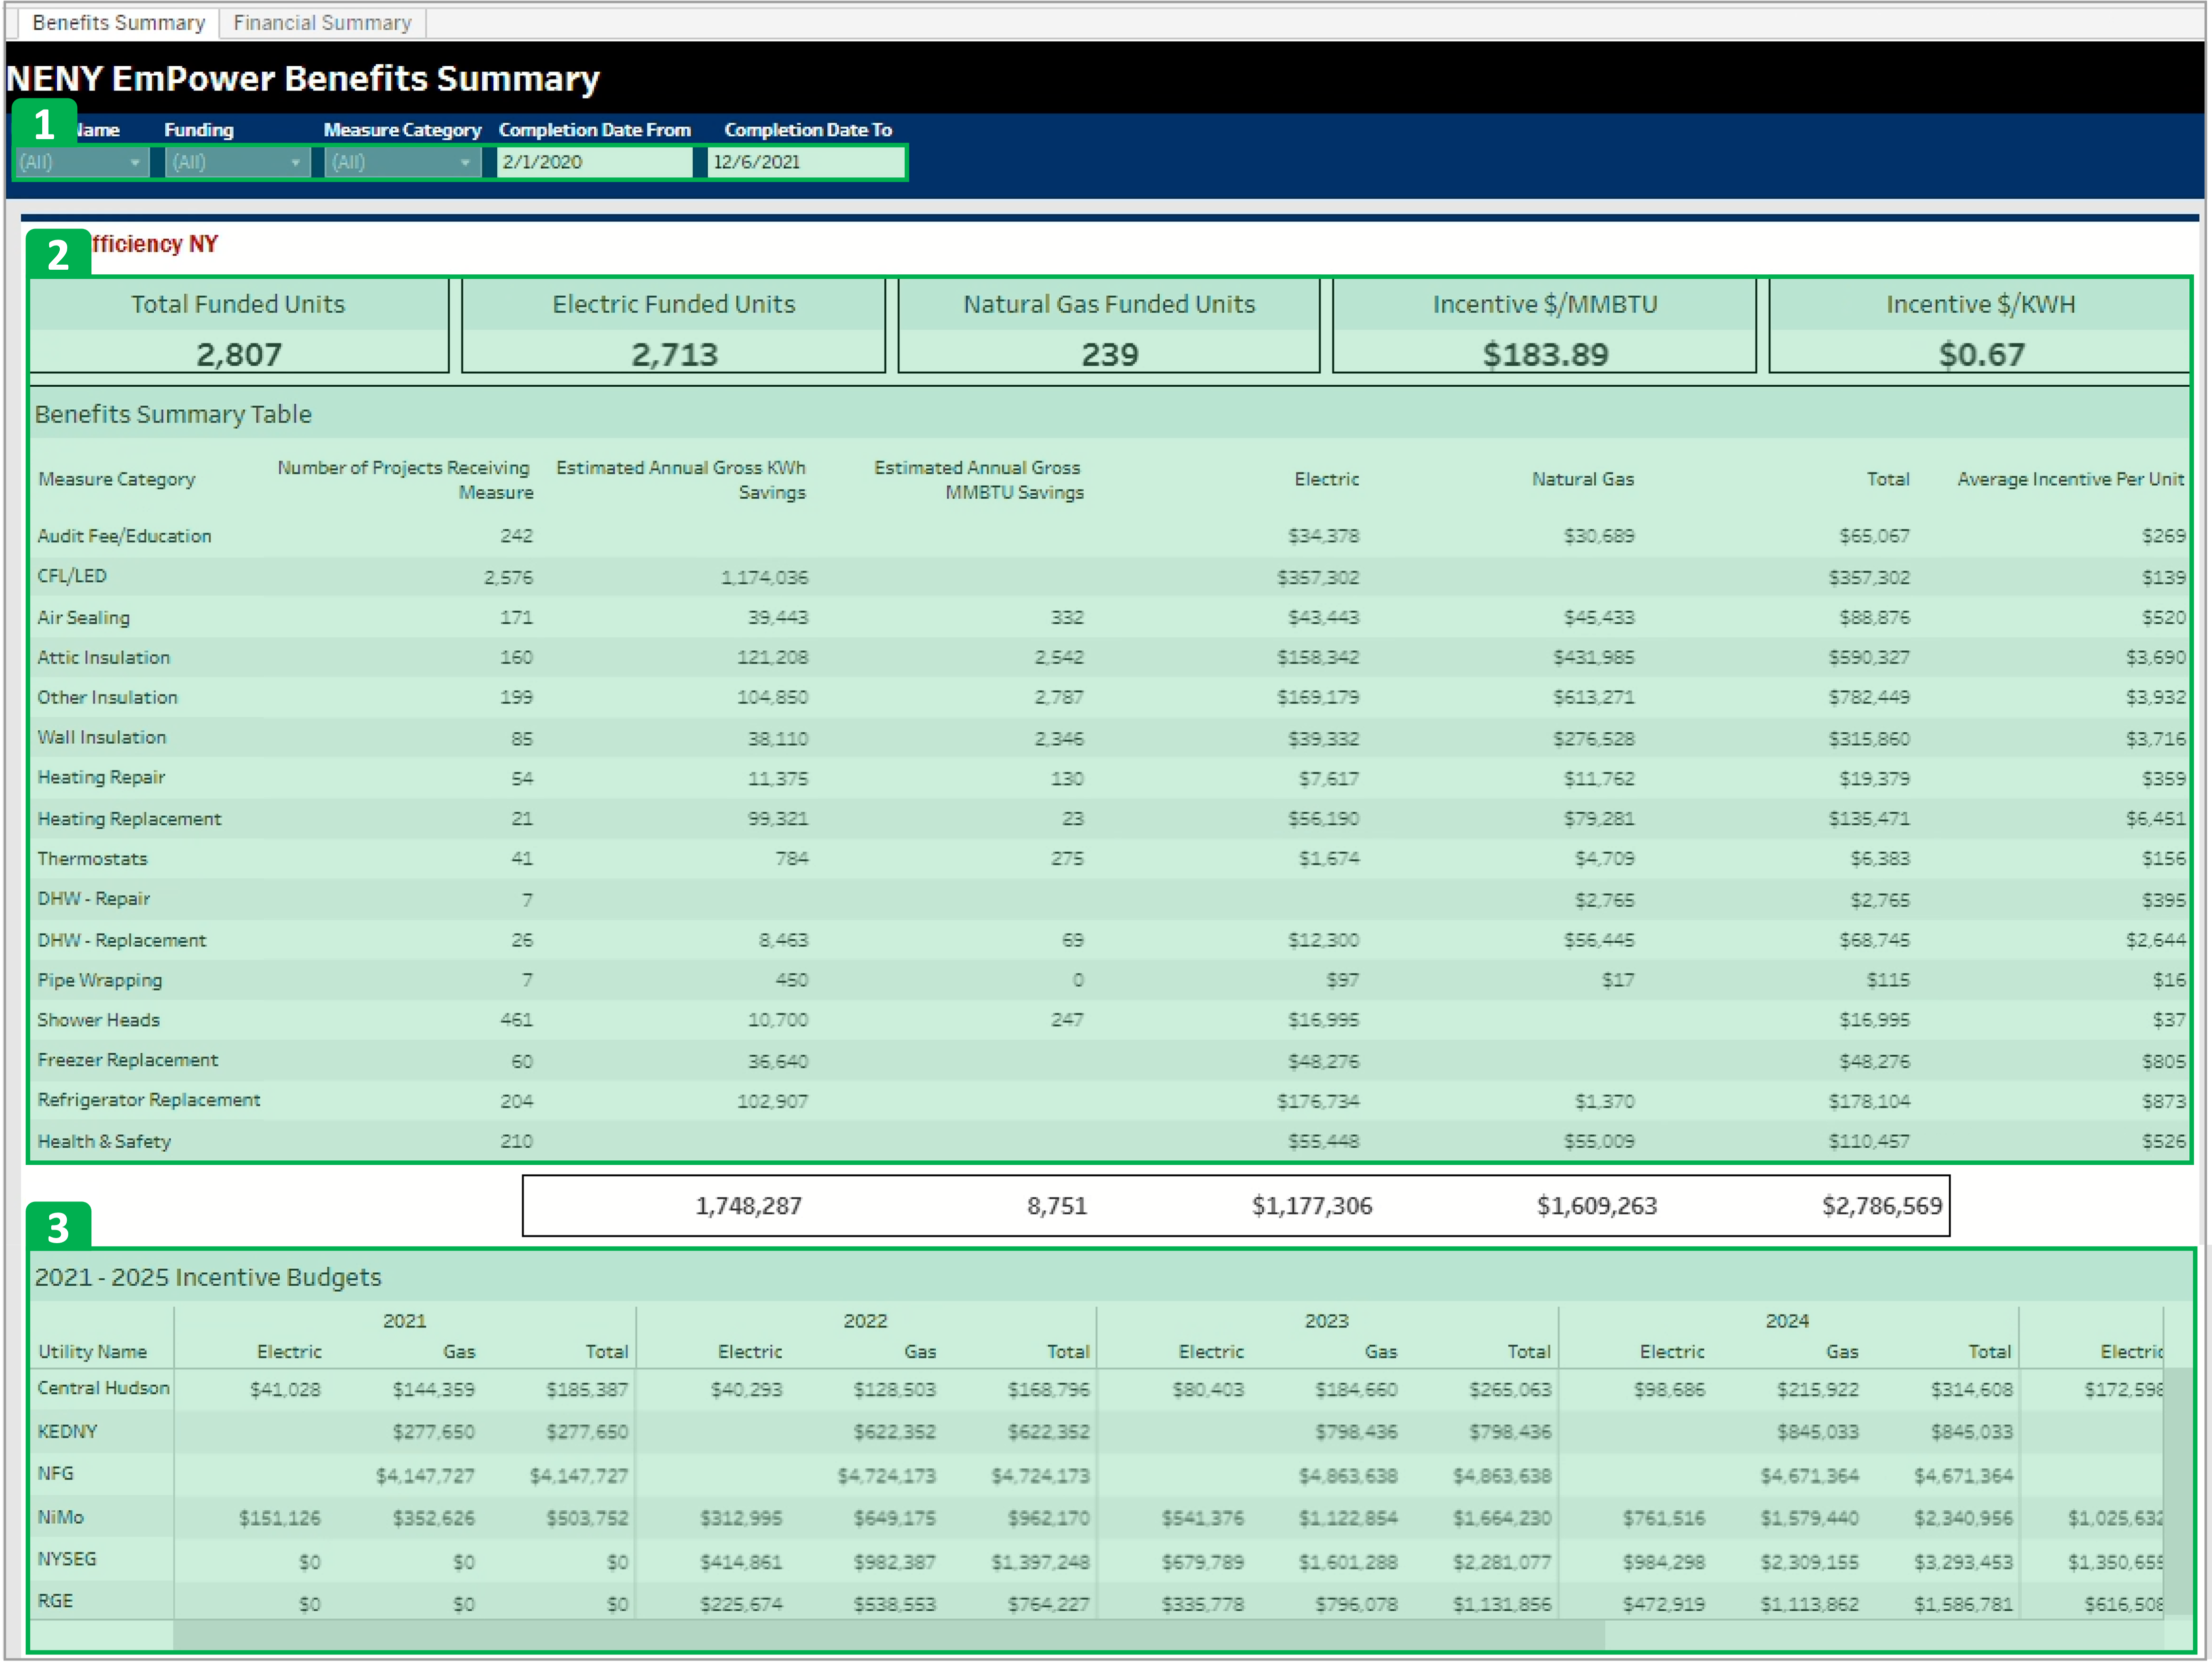 Image Added Image Added
|
|
|
|
| Aura - Panel |
|---|
| tab | 1 |
|---|
| styles | {"body":{"text":{"color":"#002d72","textAlign":"left","fontWeight":"normal","fontSize":14}},"header":{"backgroundColor":{"color":"#f3f4f9"}},"headline":{"alignment":{"horizontal":"start"},"text":{"text":"Financial Summary Report","color":"#002d72","textAlign":"left","fontWeight":"bold","fontSize":18}},"base":{"backgroundColor":{"color":"#ffffff"},"borderRadius":{"radius":4},"boxShadow":{"shadows":[{"color":"rgba(0, 0, 0, 0.08)","x":0,"y":1,"blur":1,"spread":0},{"color":"rgba(0, 0, 0, 0.16)","x":0,"y":1,"blur":3,"spread":1}]}}} |
|---|
| body | <p><br /></p> |
|---|
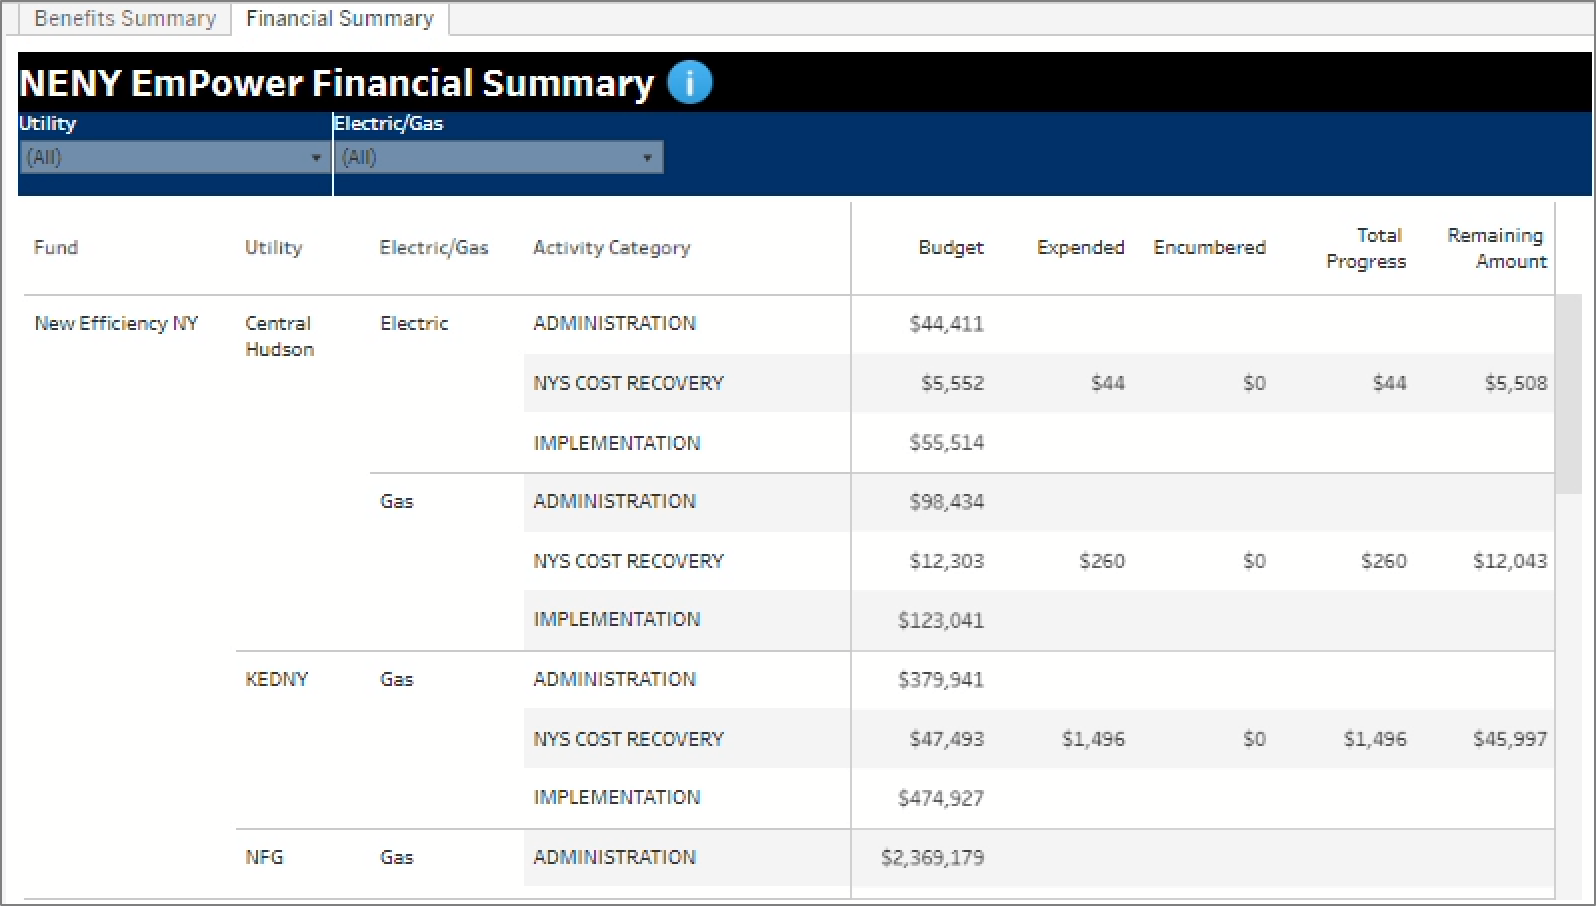
| The NENY EmPower Financial Summary provides budge information pulled from NEIS. The information allows the tracking of the new efficiency NY funding. Use this tab to learn about each of the categories. Evaluation will be added down the road under the Activity Category. | Expand |
|---|
|
| Section |
|---|
| Column |
|---|
|
| Category Title | Definition |
|---|
Budget | Budget Amount | | Expended | What Has Been Invoiced | | Encumbered(the money assigned to a contract but hasn’t been given to them) | What is Encumbered in a Contract | | Total Progress | Expended Amount + Encumbered Amount | | Remaining Amount | Budget Minus Total Progress Amount |
|
| Column |
|---|
| 
|
|
|
|
|
| Aura - Tab |
|---|
| title | NENY: SharePoint Reports |
|---|
|
| Info |
|---|
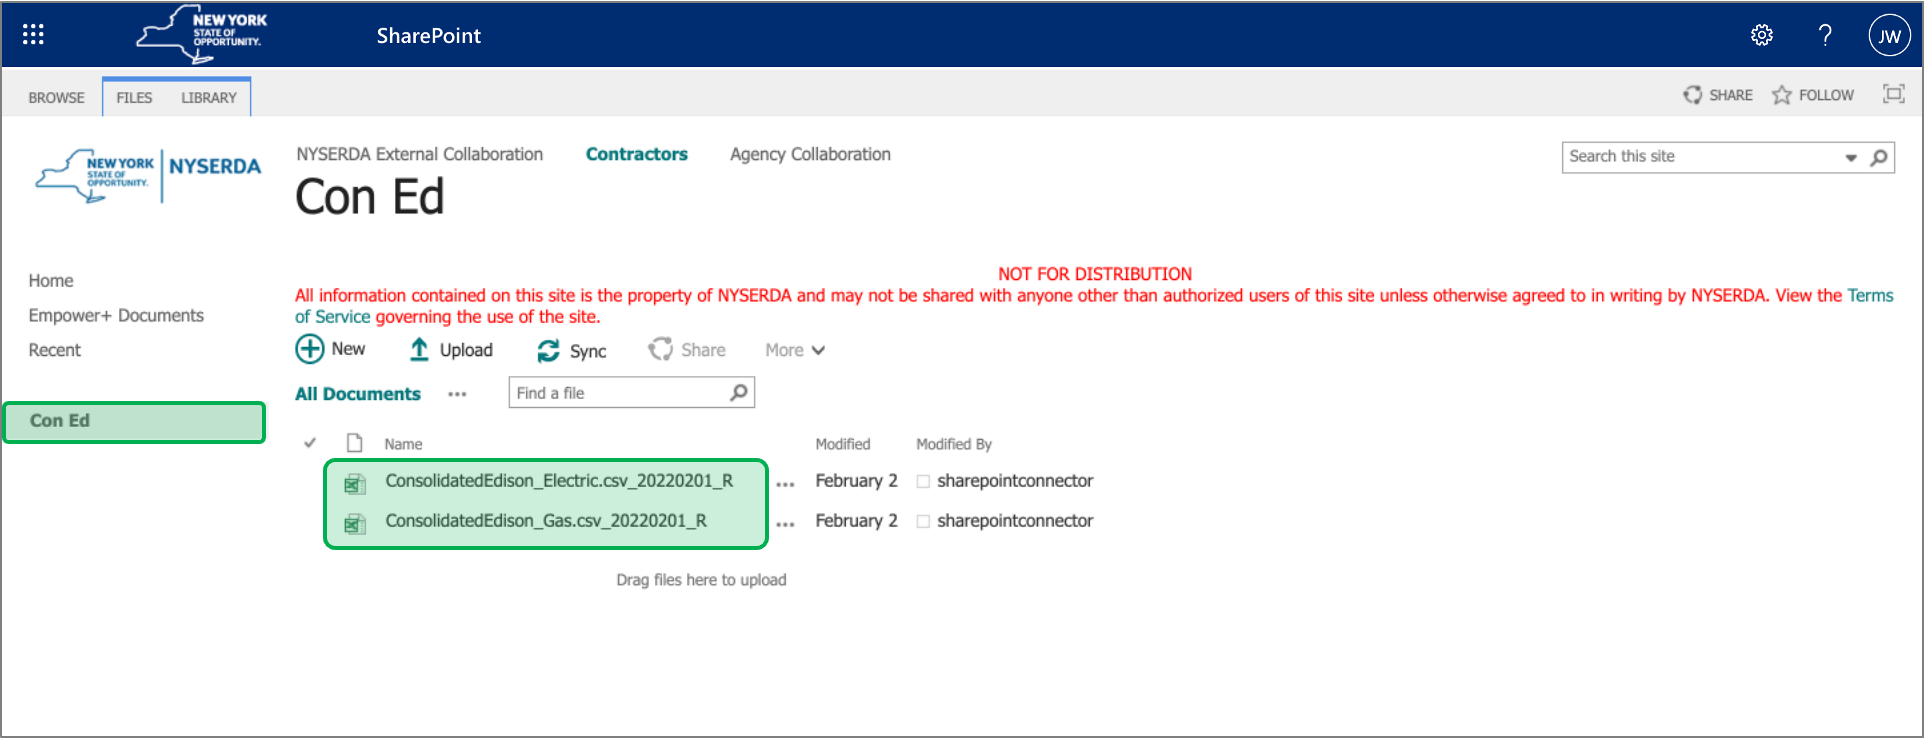
This is a once a month process for Utilities to access the SharePoint site to locate the associated folders and documents. |
| Section |
|---|
| Column |
|---|
|
| UI Steps |
|---|
|
| UI Step |
|---|
Access the EmPower SharePoint site here: | UI Button |
|---|
| color | blue |
|---|
| newWindow | true |
|---|
| size | small |
|---|
| title | EmPower+ External SharePoint Reports Site |
|---|
| url | https://tableau-qa.nyserda.org/#/site/Residential/views/NewEfficiencyNewYorkNENYEmPowerSummary/BenefitsSummary?:iid=1 |
|---|
|
|
| UI Step |
|---|
On the SharePoint site, click the applicable tab on the left navigation bar to access the associated documents. |
|
|
| Column |
|---|
| 
|
|
|
|