| Aura - Tab |
|---|
| title | NENY: Tableau Reports |
|---|
|
| Aura - Panel |
|---|
| tab | 1 |
|---|
| styles | {"body":{"text":{"color":"#002d72","textAlign":"left","fontWeight":"normal","fontSize":14}},"header":{"backgroundColor":{"color":"#f3f4f9"}},"headline":{"alignment":{"horizontal":"start"}," |
|---|
|
|
| border | top| text":"General NENY Tableau Reports Information","color": |
|
|
| false
| tab | 1 |
|---|
| Aura - Tab |
|---|
| | "#002d72","textAlign":"left","fontWeight":"bold"," |
|
|
| :true,"right":false,"bottom":false,"width":5,"style":"solid","color":"#0073a4"}}}| fontSize":18}},"base":{"backgroundColor":{"color":"#ffffff"},"borderRadius":{"radius":4},"boxShadow":{"shadows":[{"color":"rgba(0, 0, 0, 0.08)","x":0,"y":1,"blur":1,"spread":0},{"color":"rgba(0, 0, 0, 0.16)","x":0,"y":1,"blur":3,"spread":1}]}}} | | body | <p><br /></p> |
|---|
| | UI Button |
|---|
| color | blue |
|---|
| newWindow | true |
|---|
| size | small |
|---|
| title | Access the NENY Tableau Reports |
|---|
|
The NENY Tableau Reports contain two separate reports available to Utility companies, the Benefits Summary and the Financial Summary, and are accessed from the tabs at the top of the report tableau site. These reports contain no customer sensitive information. Learn more about each of these two reports below. | Tip |
|---|
Utilities are able to download report data into an excel based format, however, the data is restricted to what appears in the Tableau Reports and will not contain any other data or information. |
| Expand |
|---|
| title | how to access the report tabs... |
|---|
| 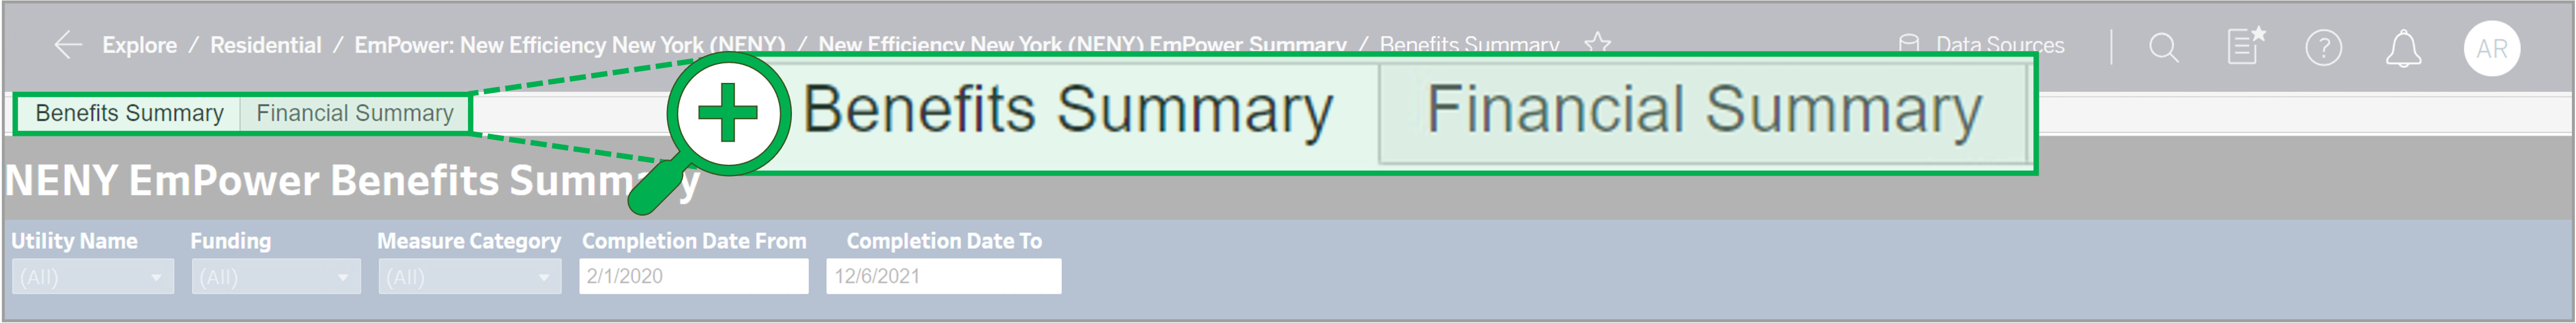 Image Added Image Added
|
|
| | Panel |
|---|
| borderColor | #002D72 |
|---|
| bgColor | #F3F4F9 |
|---|
| titleColor | #ffffff |
|---|
| borderWidth | 1 |
|---|
| titleBGColor | #002D72 |
|---|
| borderStyle | none |
|---|
| title | EmPower Tableau Report |
|---|
| | Aura - Panel |
|---|
| tab | 1 |
|---|
| styles | {"body":{"text":{"color":"#002d72","textAlign":"left","fontWeight":"normal","fontSize":14}},"header":{"backgroundColor":{"color":"#1d428a#f3f4f9"}},"headline":{"alignment":{"horizontal":"start"},"text":{"text":"Benefits Summary Report","color":"#ffffff#002d72","textAlign":"left","fontWeight":"bold","fontSize":18}},"base":{"backgroundColor":{"color":"#ffffff"},"borderRadius":{"radius":4},"boxShadow":{"shadows":[{"color":"rgba(0, 0, 0, 0.08)","x":0,"y":1,"blur":1,"spread":0},{"color":"rgba(0, 0, 0, 0.16)","x":0,"y":1,"blur":3,"spread":1}]}}} |
|---|
| body | <p><br /></p> |
|---|
| info | The Benefits Summary table is an overnight batch process that holds data from the Project Management Database for completed work. report provides specific details regarding incentives paid out to Utilities and should be used to determine the current incentives expenditures with respect to the Utilities annual budget and only references completed work. This data is updated once per day outside of normal working hours. | Expand |
|---|
|
| Section |
|---|
| Column |
|---|
|
| UI Steps |
|---|
|
| UI Step |
|---|
The filters allows Utility to further filter and look at specific measures. | Tip |
|---|
The Completion Date From filter allows user to chose only year, month, or specific date. The filter however, may not be saved. |
This section of the report contains the report filters. Filters provide Utilities the ability to narrow down the report information. Filters cannot be saved and will need to be reset each time a Utility accesses the report. Additionally, the available filters only effect the Benefits Summary Table section of this report and will not filter the Incentive Budget table at the bottom of this report or the Financial Summary report found in the other tab.
| Tooltip |
|---|
| linkTextStrong | true |
|---|
| appendIcon | info-filled |
|---|
| linkTextUnderline | true |
|---|
| iconColor | #0073A4 |
|---|
| linkText | Report Filter Details |
|---|
| linkTextColor | #0073A4 |
|---|
| linkTextUnderlineColor | #0073A4 |
|---|
|
| Filter Name | Filter Description/Requirements |
|---|
| Utility Name | Utilities must select their company from this filter to see their organizations data. | | Funding | Use this filter to select between the Electric of Gas data. | | Measure Category | Use this filter to show data only for specific measures. Multiple options can be selected. | | Completion Date From | Use to filter the data by the earliest possible date for data inclusion. | | Completion Date To | Use to filter the data by the latest possible date for data inclusion. |
|
|
| UI Step |
|---|
The Benefits Summary Table contains a high-level overview of the Utilities performance with respect to NENY funding as well as a detailed breakdown based on Measure. Any change to, or use of, the filters at the top of the report will only filter this section of the report | | UI Step |
|---|
Utility can see an overview of the funding at a high level to see where the New Efficiency NY funding is being used. |
| UI Step |
|---|
The Incentive Budgets information is pulled from NEIS(incentive only), it provides a snapshot of what the expenditures are for a particular utility. | Tip |
|---|
Even if the top part of the page is filtered, the Incentive Budgets table does not get filteredThe Incentive Budget section of the report provides a high-level overview of how each Utility is performing compared to their annual incentive budgets, broken out first by Year, then by Funding. While this data is updated daily the report filters at the top. of the report will not filter this table. Utilities will need to scroll through the alphabetized list to locate their company and associated budget information. |
|
|
| Column |
|---|
| 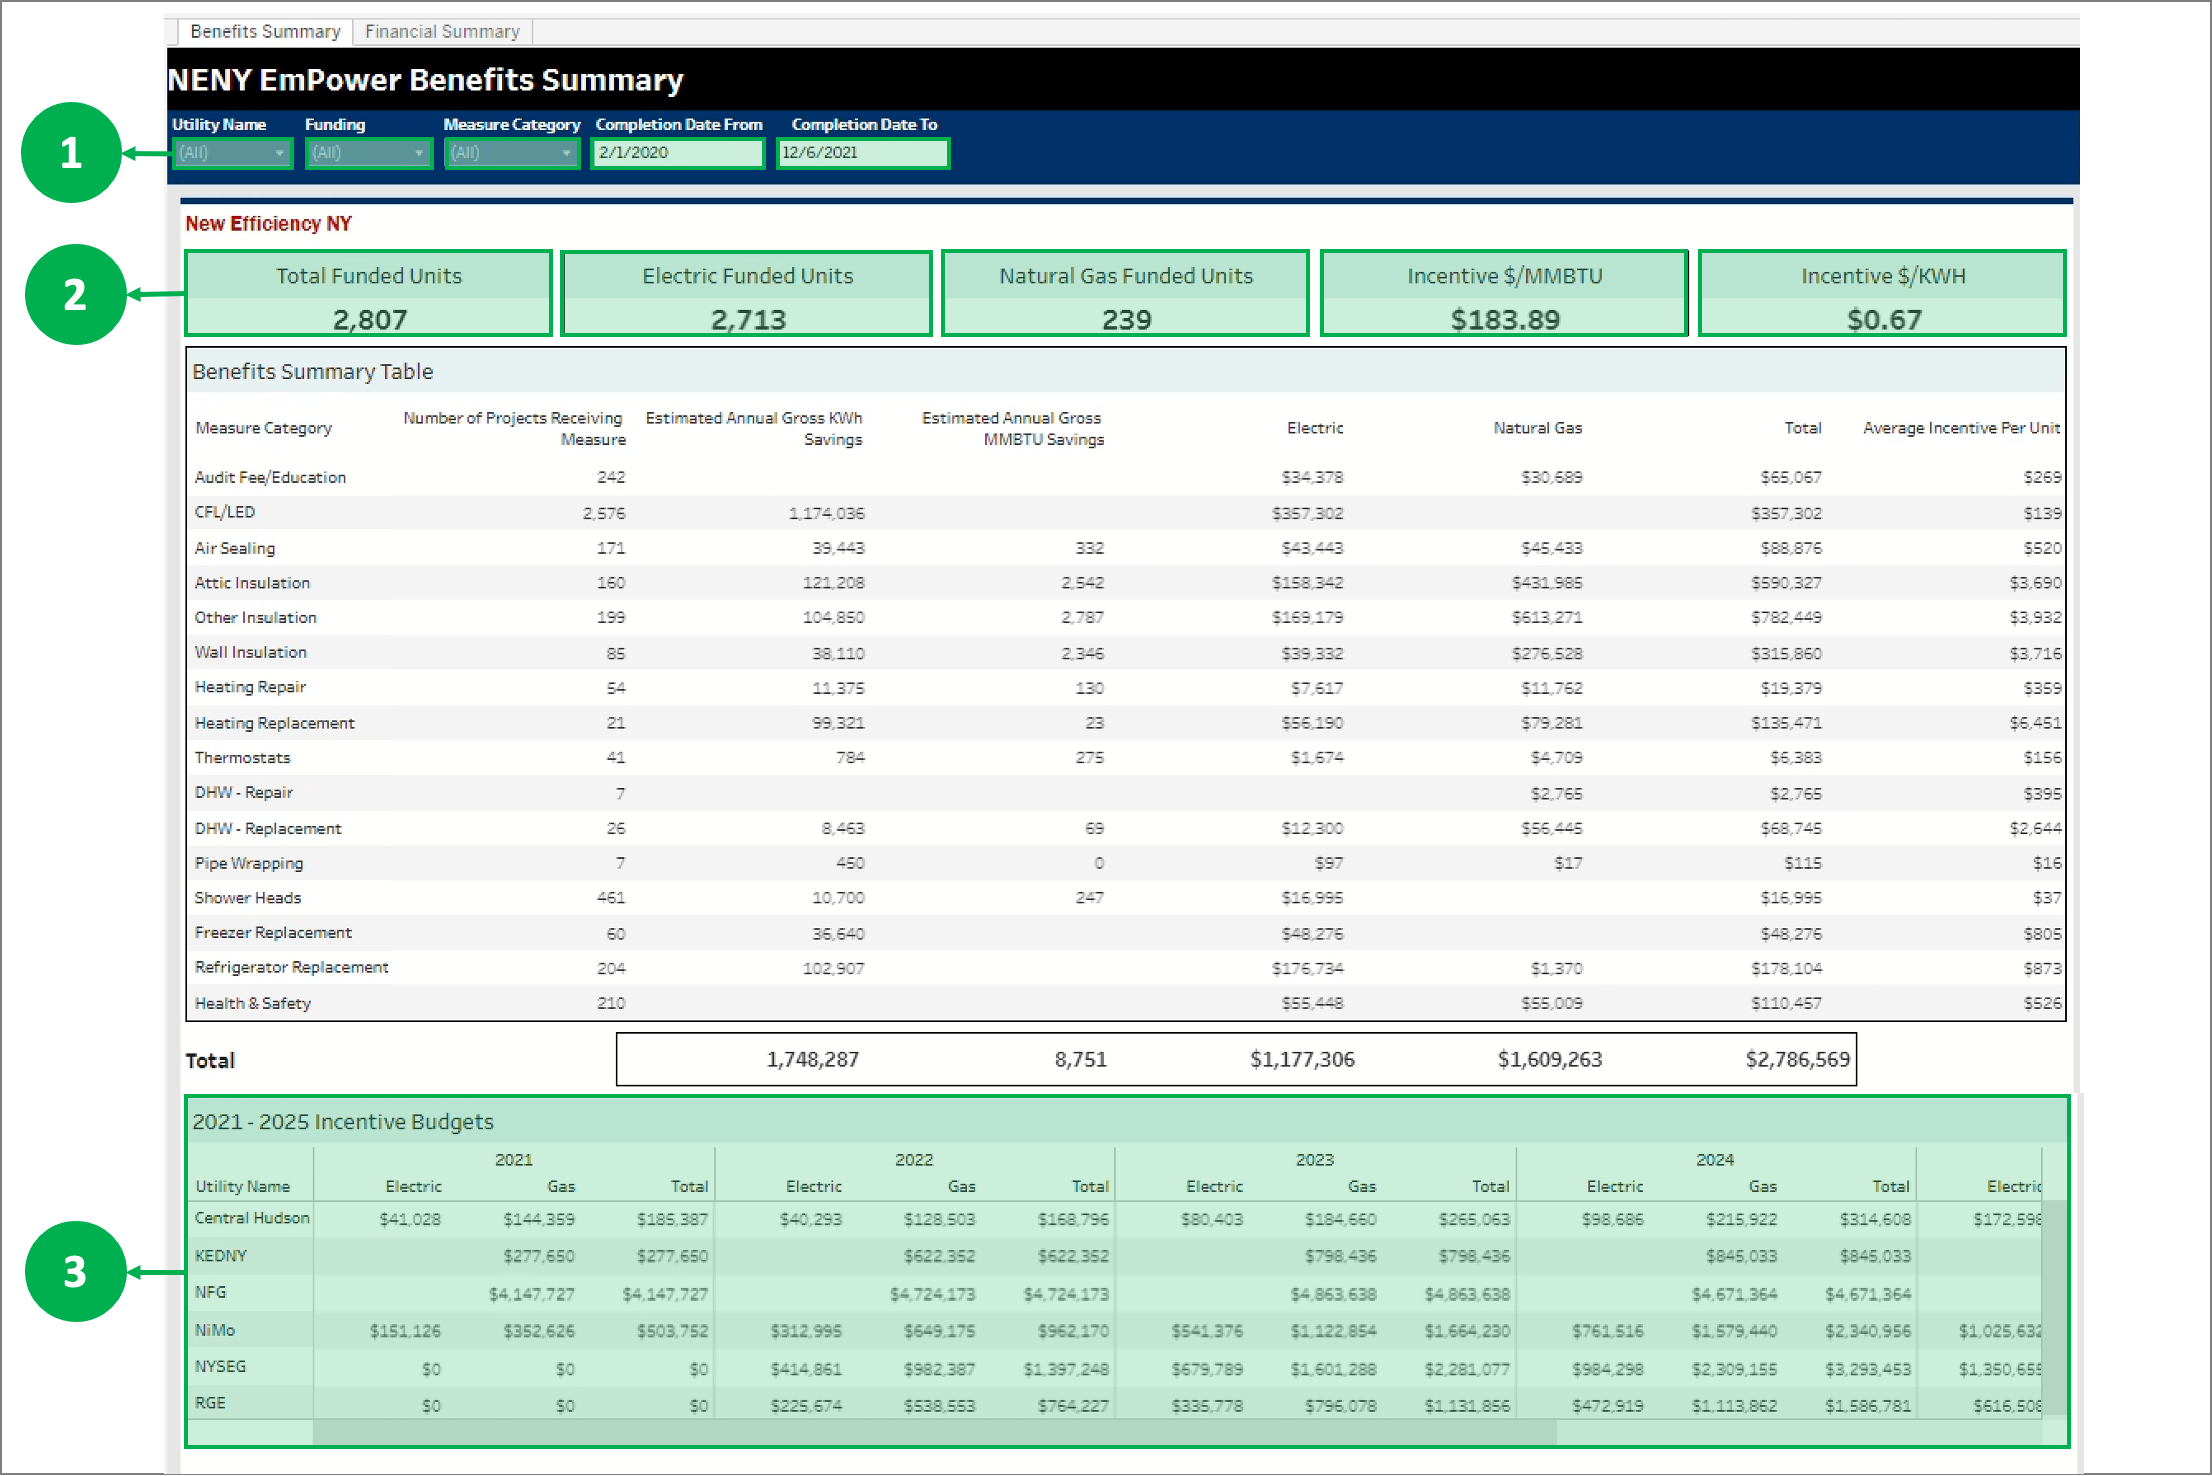 Image Removed Image Removed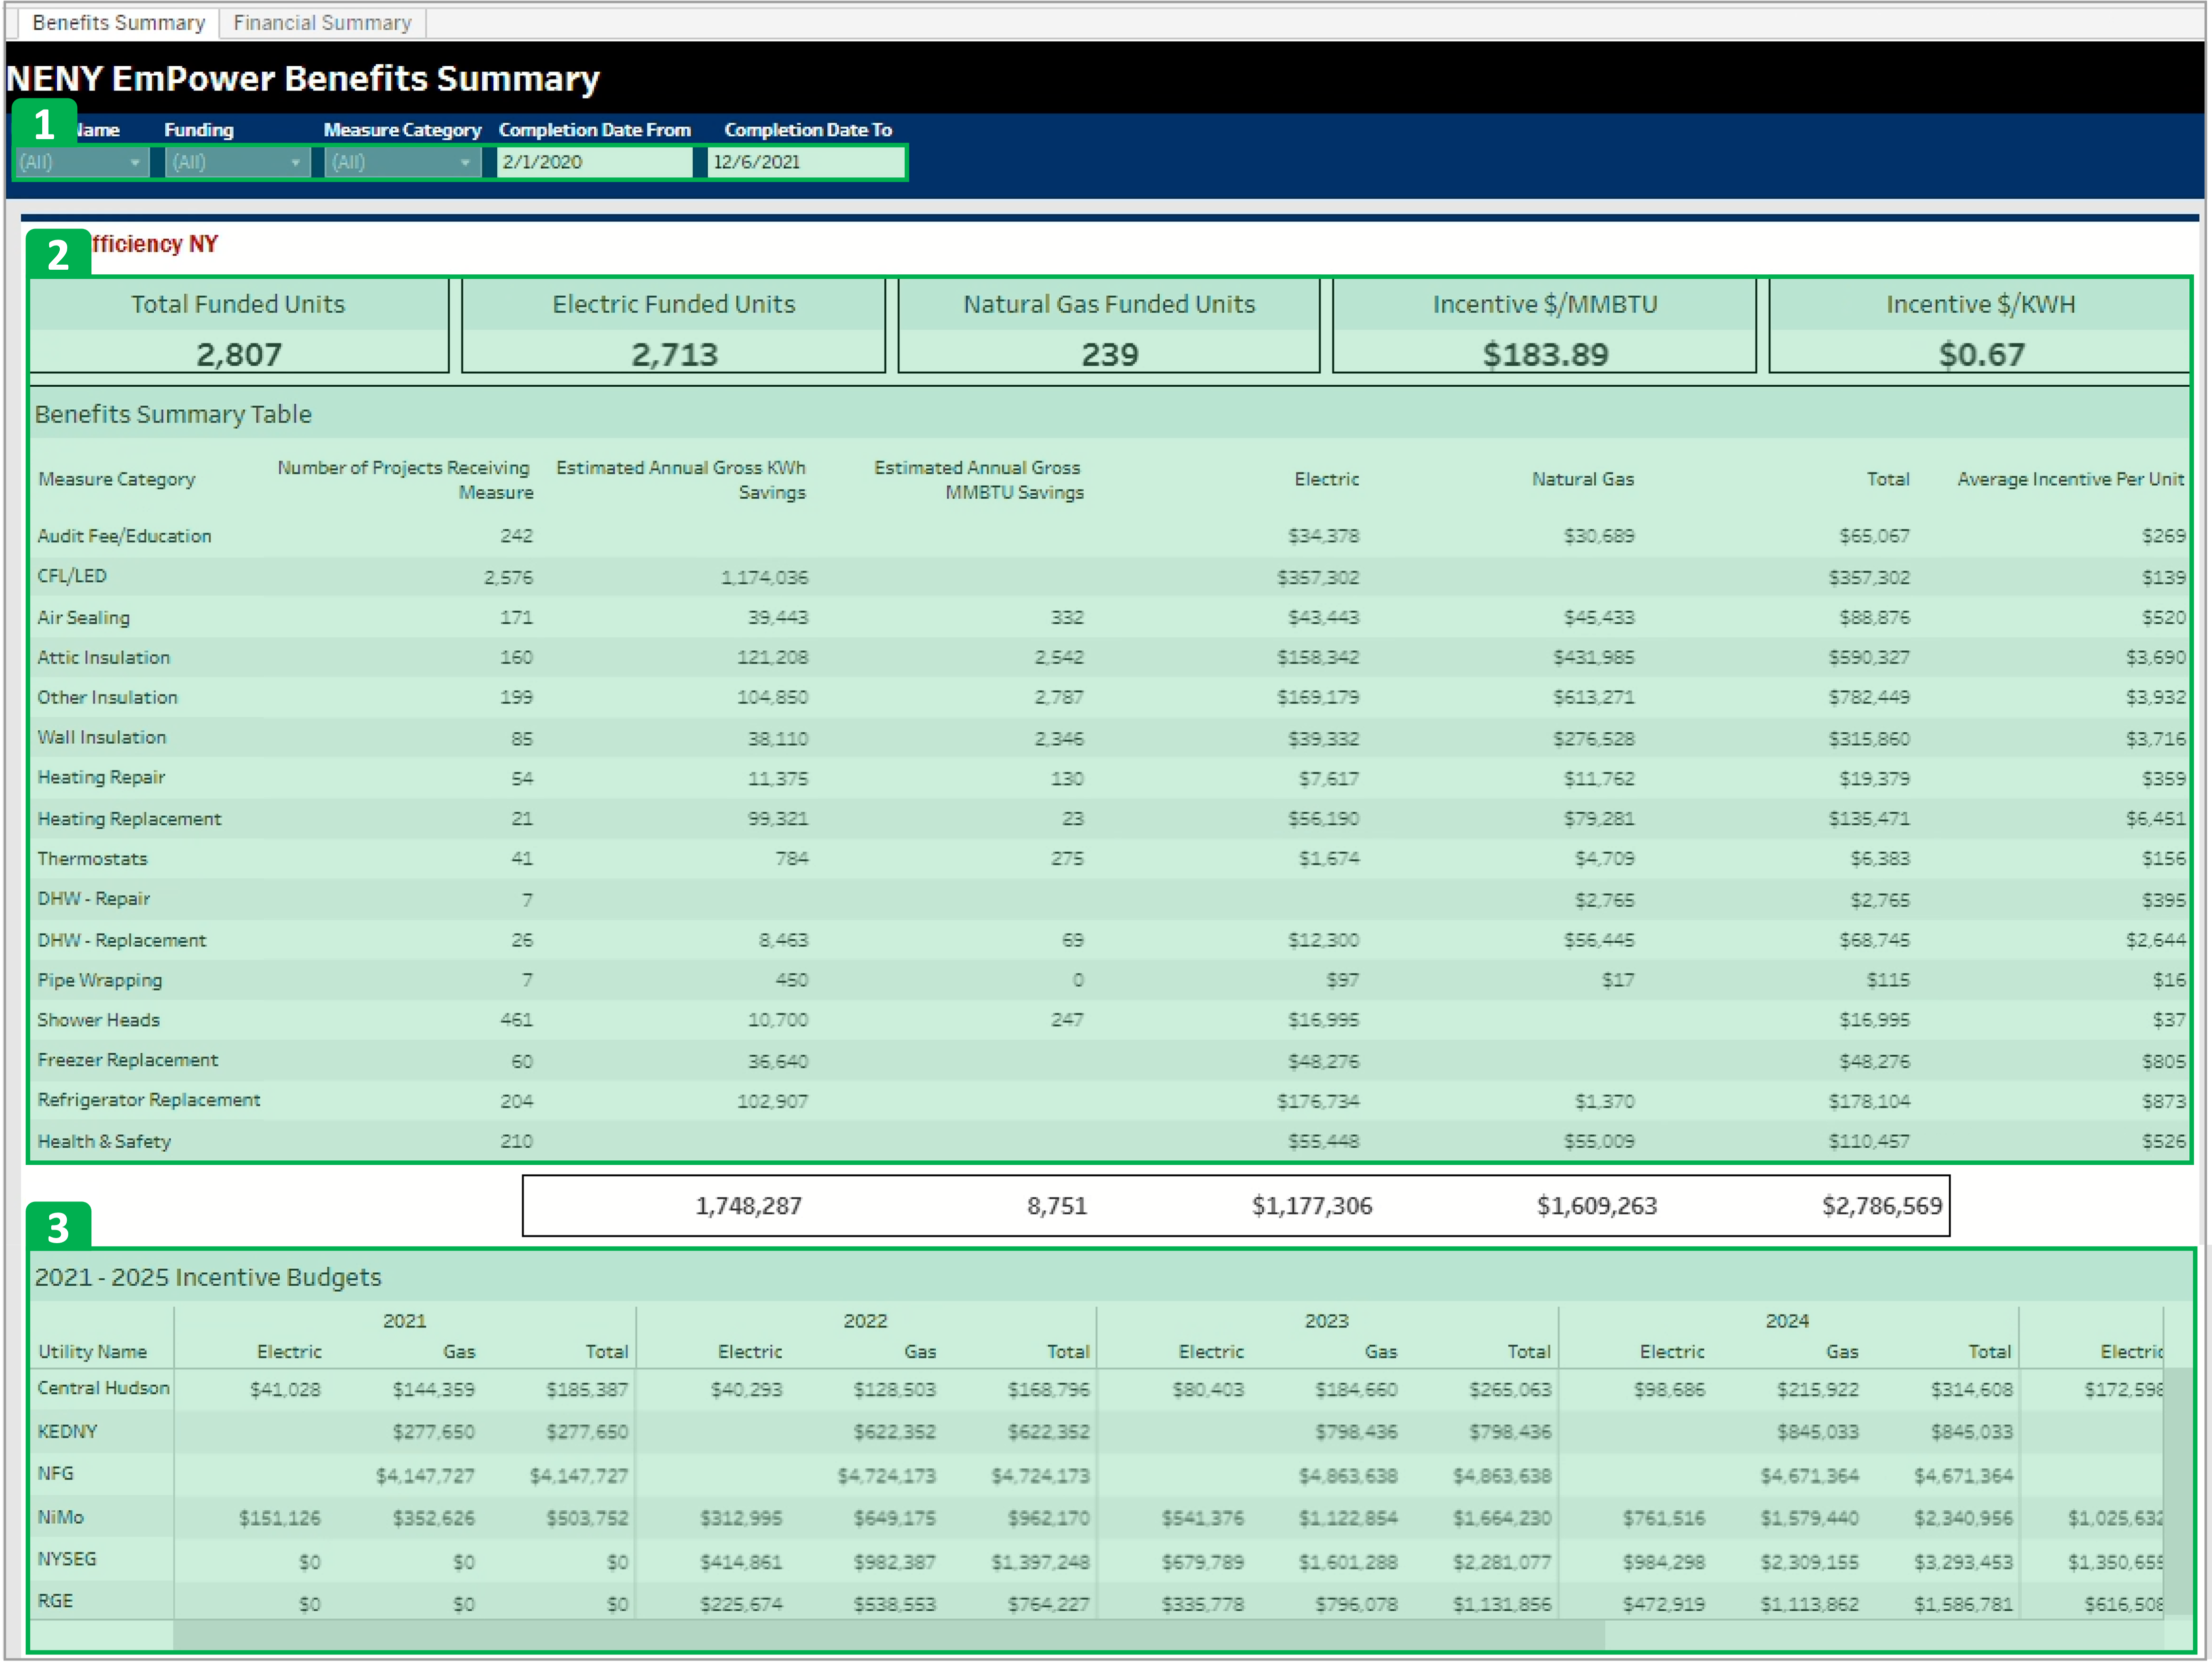 Image Added Image Added
|
|
|
|
| Aura - Panel |
|---|
| tab | 1 |
|---|
| styles | {"body":{"text":{"color":"#002d72","textAlign":"left","fontWeight":"normal","fontSize":14}},"header":{"backgroundColor":{"color":"#6787b7#f3f4f9"}},"headline":{"alignment":{"horizontal":"start"},"text":{"text":"Financial Summary Report","color":"#ffffff#002d72","textAlign":"left","fontWeight":"bold","fontSize":18}},"base":{"backgroundColor":{"color":"#ffffff"},"borderRadius":{"radius":4},"boxShadow":{"shadows":[{"color":"rgba(0, 0, 0, 0.08)","x":0,"y":1,"blur":1,"spread":0},{"color":"rgba(0, 0, 0, 0.16)","x":0,"y":1,"blur":3,"spread":1}]}}} |
|---|
| body | <p><br /></p> |
|---|
| | info The NENY EmPower+ Financial Summary provides budge information pulled from NEIS. This information allows the tracking of the new efficiency NY funding. Use this tab to learn about each of the categories. Evaluation will be added down the road under the Activity Category. |
| aura-tab | title | SharePoint | panel | borderColor | #002D72 | | bgColor | #F3F4F9 |
|---|
| titleColor | #ffffff |
|---|
| borderWidth | 1 |
|---|
| titleBGColor | #002D72 |
|---|
| borderStyle | none |
|---|
| title | EmPower SharePoint Site |
|---|
| Info |
|---|
| Section |
|---|
Budget | Represents the Incentive Budget broken out first by Utility Type (Electric or Gas), then by Activity Category. | | Expended | Represents the value of incentives that have already been Invoiced against and paid out by NYSERDA. | | Encumbered | Represents the value of incentives that have been earmarked in our systems but have not yet been paid out to the Utility. | | Total Progress | = Expended + Encumbered | | Remaining Amount | = Budget - Total Progress |
|
| Column |
|---|
| 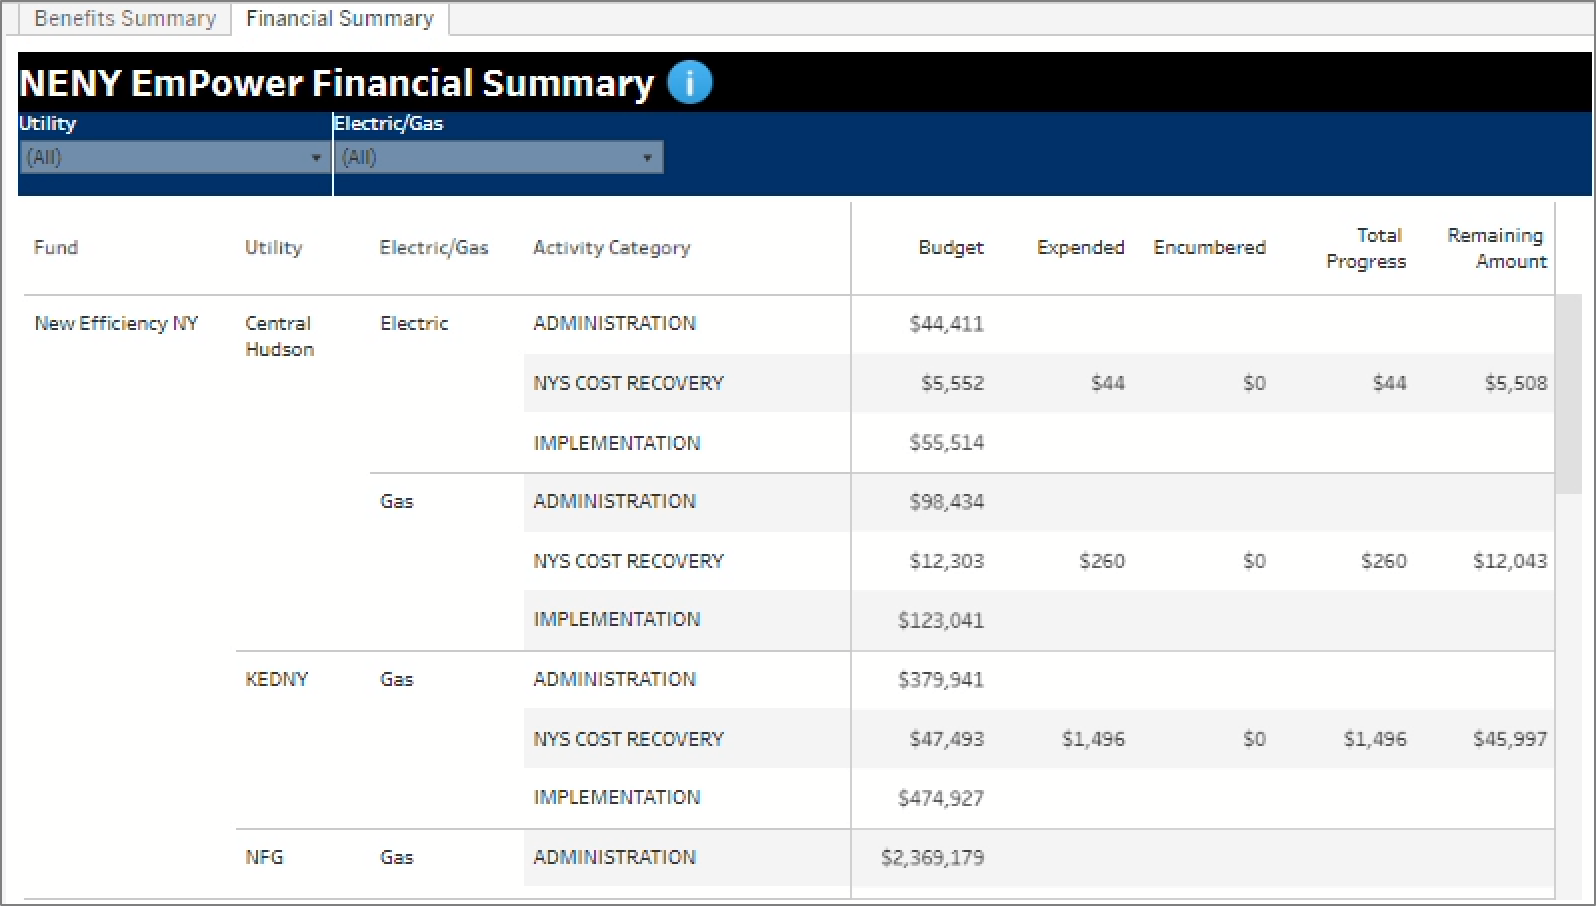 Image Added Image Added
|
|
|
|
|
| Aura - Tab |
|---|
| title | NENY: SharePoint Reports |
|---|
|
| Aura - Panel |
|---|
| tab | 1 |
|---|
| styles | {"body":{"text":{"color":"#002d72","textAlign":"left","fontWeight":"normal","fontSize":14}},"header":{"backgroundColor":{"color":"#f3f4f9"}},"headline":{"alignment":{"horizontal":"start"},"text":{"text":"General NENY SharePoint Reports Information","color":"#002d72","textAlign":"left","fontWeight":"bold","fontSize":18}},"base":{"backgroundColor":{"color":"#ffffff"},"borderRadius":{"radius":4},"boxShadow":{"shadows":[{"color":"rgba(0, 0, 0, 0.08)","x":0,"y":1,"blur":1,"spread":0},{"color":"rgba(0, 0, 0, 0.16)","x":0,"y":1,"blur":3,"spread":1}]}}} |
|---|
| body | <p><br /></p> |
|---|
| | Column |
|---|
| | | UI Steps |
|---|
| | UI Step |
|---|
Access the EmPower SharePoint site here: | Aura - Button |
|---|
| elevation | flat |
|---|
| color | #FFFFFF |
|---|
| icon | faExternalLinkAlt |
|---|
| label | EmPower |
|---|
| outlined | regular |
|---|
| borderRadius | 10 |
|---|
| size | small |
|---|
| background | #0073a4 |
|---|
| iconPosition | right |
|---|
| hrefTarget | _self |
|---|
| hrefType | link |
|---|
href | | UI Button |
|---|
| color | blue |
|---|
| newWindow | true |
|---|
| size | small |
|---|
| title | Access the NENY SharePoint Reports |
|---|
| url |
|---|
|
| https://tableau-qa.nyserda.org/#/site/Residential/views/NewEfficiencyNewYorkNENYEmPowerSummary/BenefitsSummary?:iid=1 |
|
The EmPower+ SharePoint site contains two NENY reports for each Utility representing Electric and Gas incentive data. These reports are updated once per month on the first of each month and should be used in conjunction with the NENY Tableau Reports as needed. The NENY SharePoint Reports differ from the NENY Tableau Reports in several key ways: - They contain customer sensitive information so these reports must be protected at all times, and
- They are cumulative. As each report is generated, the new information is appended to the previous report so each report contains all new and historical incentive data.
Additionally, Utilities are only able to see reports for their specific Utility and will not be able to access any other Utility reports.
| Aura - Panel |
|---|
| tab | 1 |
|---|
| styles | {"body":{"text":{"color":"#002d72","textAlign":"left","fontWeight":"normal","fontSize":14}},"header":{"backgroundColor":{"color":"#f3f4f9"}},"headline":{"alignment":{"horizontal":"start"},"text":{"text":"Report Details","color":"#002d72","textAlign":"left","fontWeight":"bold","fontSize":18}},"base":{"backgroundColor":{"color":"#ffffff"},"borderRadius":{"radius":4},"boxShadow":{"shadows":[{"color":"rgba(0, 0, 0, 0.08)","x":0,"y":1,"blur":1,"spread":0},{"color":"rgba(0, 0, 0, 0.16)","x":0,"y":1,"blur":3,"spread":1}]}}} |
|---|
| body | <p><br /></p> |
|---|
|
| Section |
|---|
| Column |
|---|
| Once on the Empower+ SharePoint site, access your Utilities document library by clicking the Utility name in the left-hand navigation pane. Once the page refreshes, you will see the two NENY reports, one for Electric incentive data and another for Gas incentive data | left | | UI Step |
|---|
On the SharePoint site, click the applicable tab on the left navigation bar to access the associated documents.
| 70%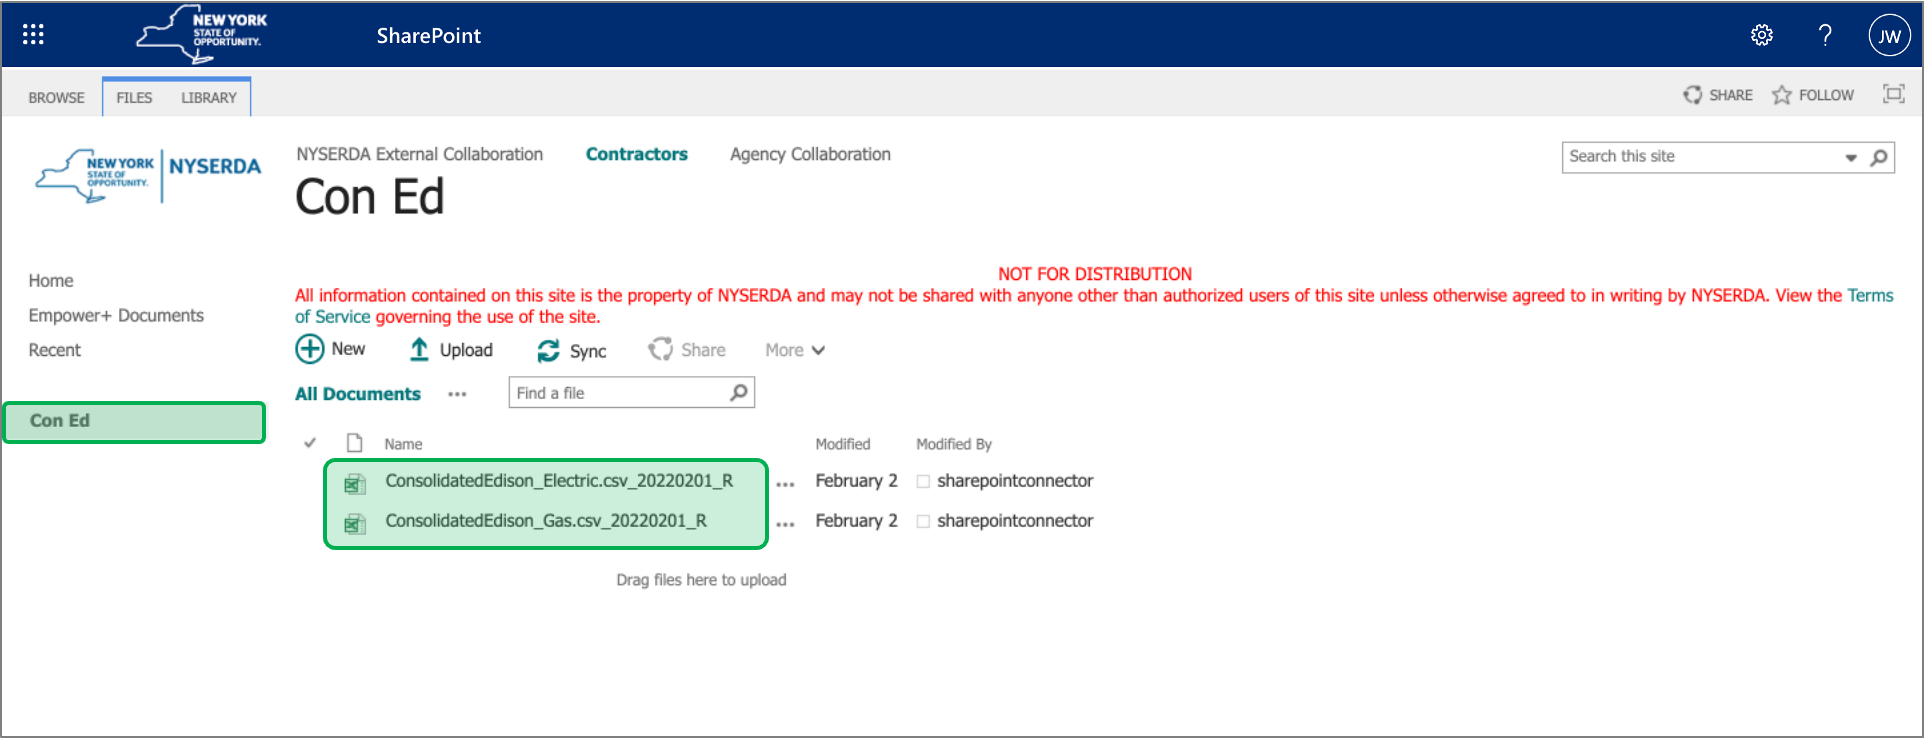 Image Removed Image Removed Image Added Image Added
|
|
|
|
|