| Aura - Background Content | ||||||||||||||||||||||||||||||||||||
|---|---|---|---|---|---|---|---|---|---|---|---|---|---|---|---|---|---|---|---|---|---|---|---|---|---|---|---|---|---|---|---|---|---|---|---|---|
| ||||||||||||||||||||||||||||||||||||
|
| Aura - Panel | |||||||||||
|---|---|---|---|---|---|---|---|---|---|---|---|
| |||||||||||
|
| Aura - Panel | ||||||
|---|---|---|---|---|---|---|
| ||||||
|
| Aura - Panel | ||||||
|---|---|---|---|---|---|---|
| ||||||
| Aura - Panel | |||||||||||||||||||||||||||||||
|---|---|---|---|---|---|---|---|---|---|---|---|---|---|---|---|---|---|---|---|---|---|---|---|---|---|---|---|---|---|---|---|
| |||||||||||||||||||||||||||||||
Vornado Realty Trust (VNO) and their team of consultants shown above, followed the Playbook approach to define the decarbonization roadmap for PENN 1. The iconic midcentury building consists of 57 stories totaling 2.5 million gross square feet.
|
| Aura - Panel | ||||||
|---|---|---|---|---|---|---|
| ||||||
Getting StartedThe Vornado sustainability team, in collaboration with the PENN 1 building management team, assembled a project team with deep expertise across multiple disciplines that could address the level of complexity, interdisciplinary thinking, and innovation needed to develop a decarbonization roadmap for PENN 1. The core project team consisted of:
At the onset of the project, the team took an aggressive approach to building decarbonization, and focused on eliminating all dependence on district steam and natural gas. The following guiding questions were used in this first round of analysis:
Later in the project, after an initial round of analysis and results, the project team re-evaluated and adjusted the approach to decarbonizing the building. A new set of guiding questions were developed as the study entered a second phase:
|
| Aura - Panel | ||||||
|---|---|---|---|---|---|---|
| ||||||
Building DiscoveryLearn the BuildingThe project team collected, studied and analyzed several key pieces of information over the study period, including:
To keep information organized, the JB&B team deployed a checklist of requested documentation with clear indication of each item’s importance to the development of the building’s calibrated energy model. The JB&B Team also developed a questionnaire that was used to guide discussions with the building’s operations team during building walkthroughs and surveys
Figure 1: Sample Facility Data Collection Checklists |


| Aura - Panel | |||||||||
|---|---|---|---|---|---|---|---|---|---|
| |||||||||
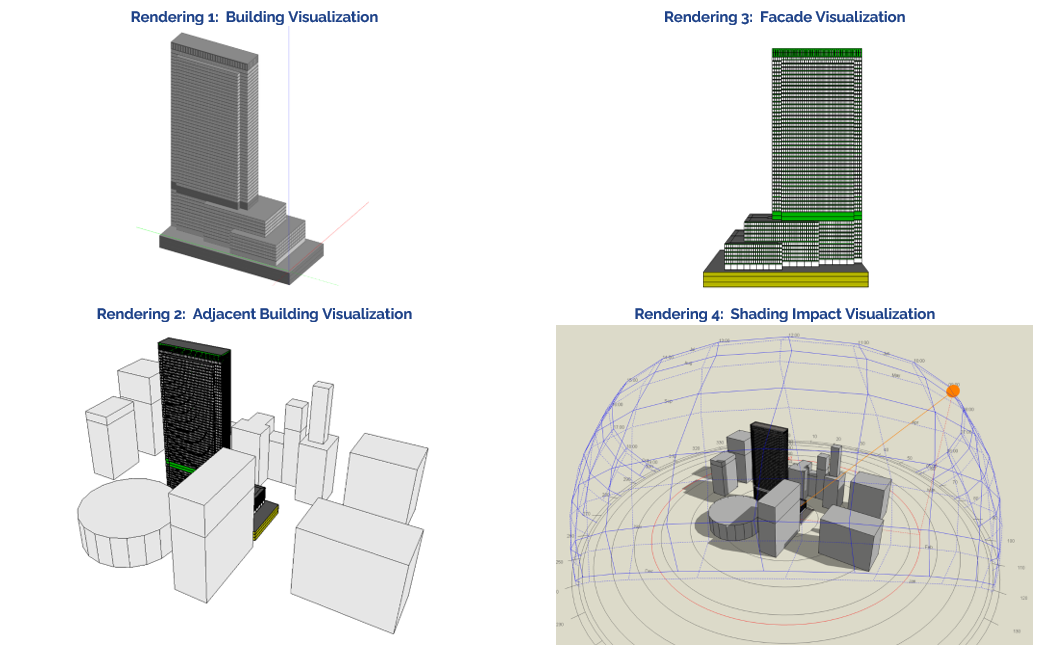
Energy & Carbon ModelingBuild and Calibrate the Initial Energy ModelThe initial energy model was developed using the graphical interface DesignBuilder® with EnergyPlus as the calculation and simulation engine. Building attributes such as floor dimensions, lighting, plug loads, HVAC layouts, and detailed schedules were included in the model to reflect the general parameters of the existing building conditions.
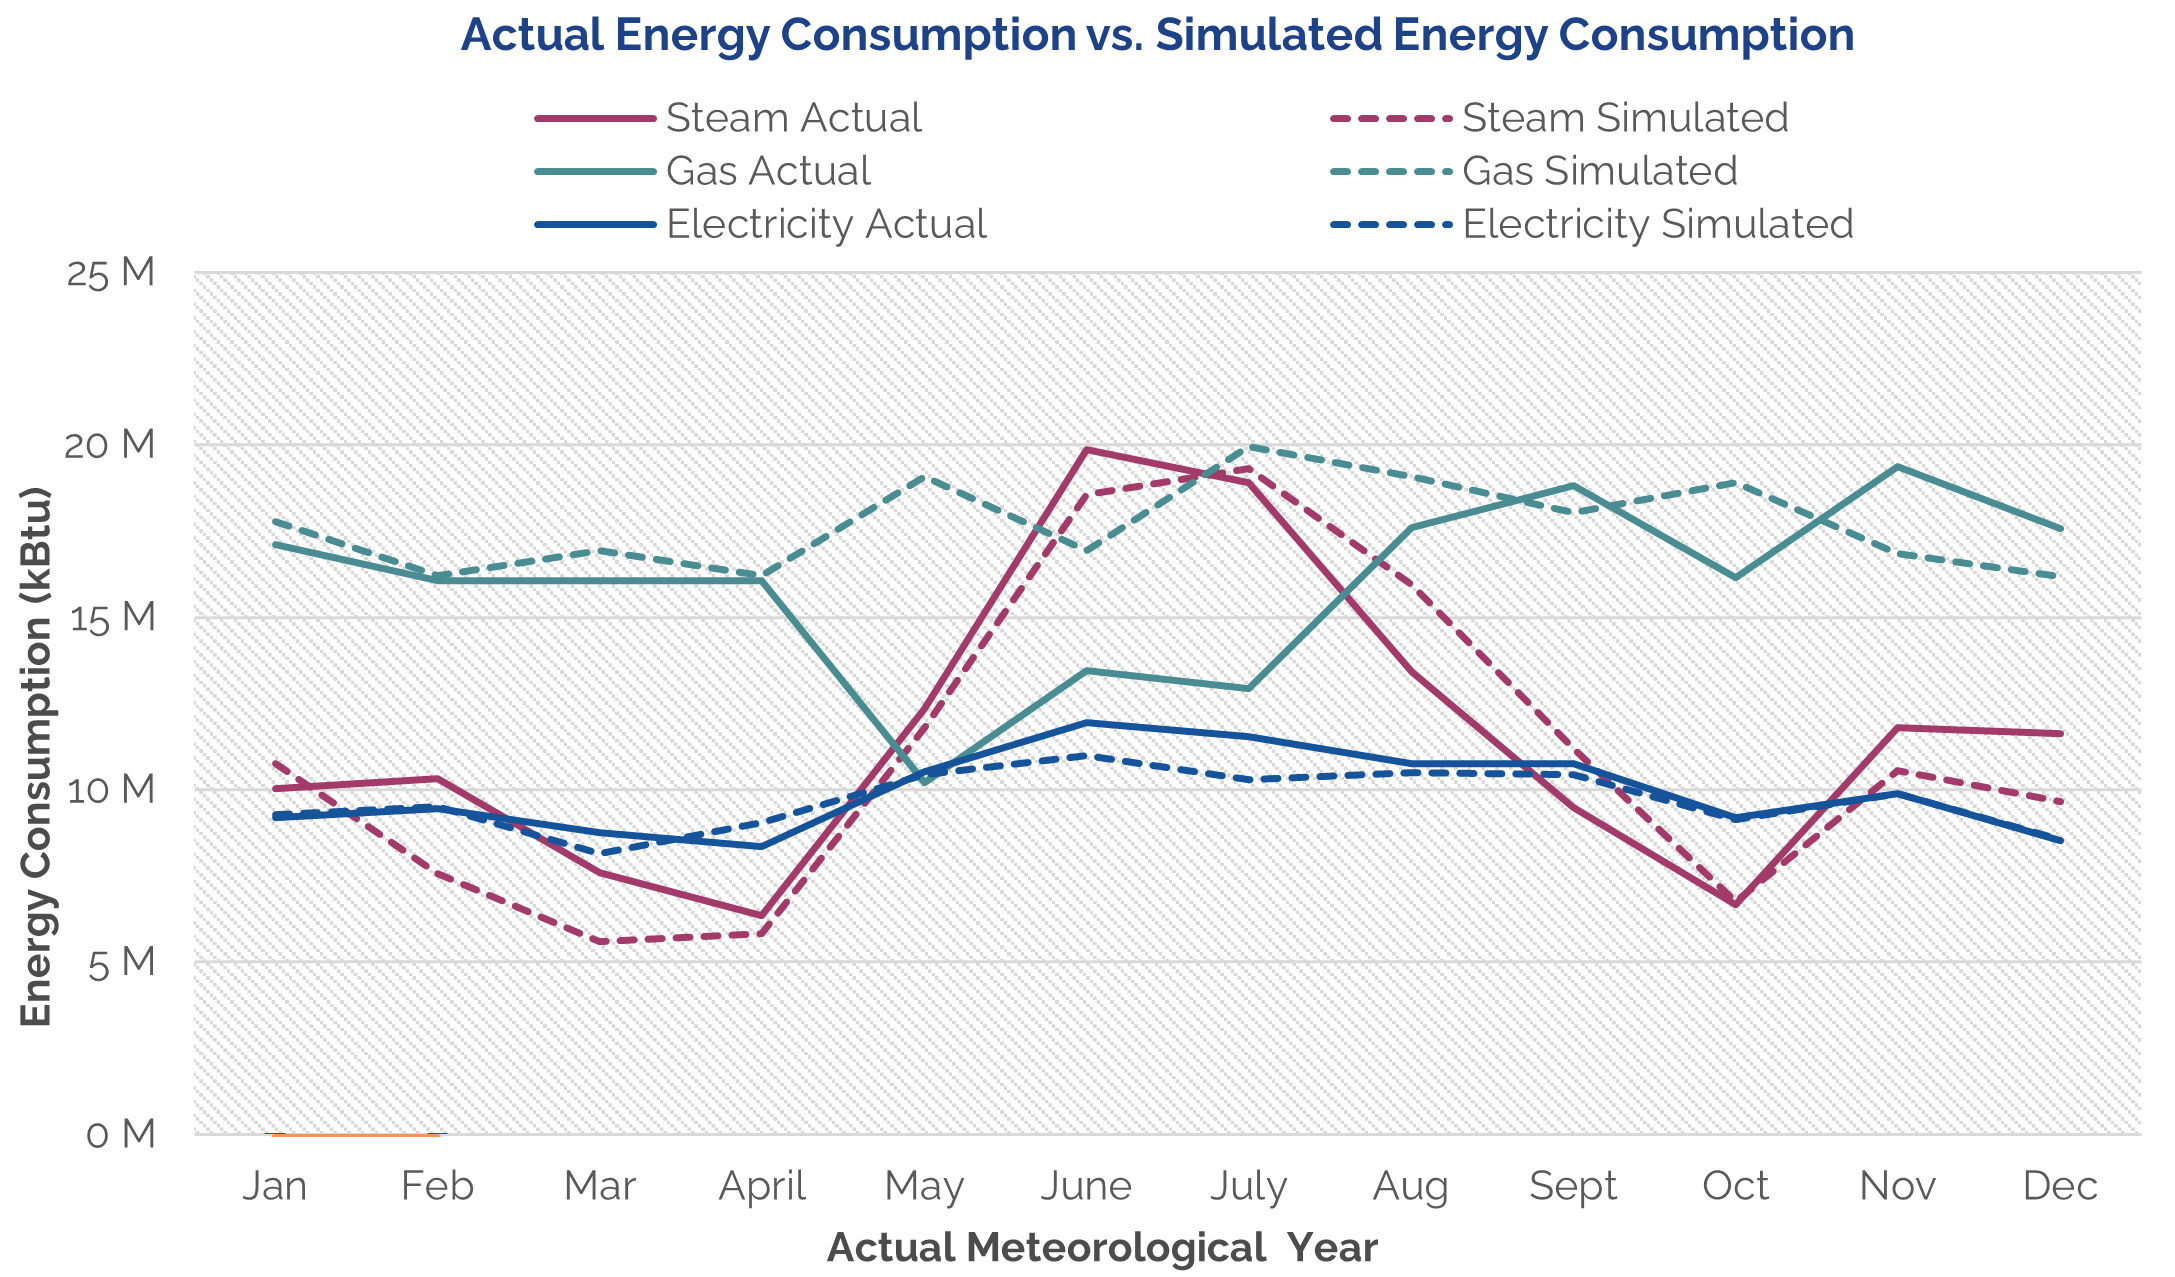
Figure 7 – Energy Model Renderings Through an iterative process, the energy model inputs were modified to align the calculated energy model outputs with actual building utility data (sample compound years as discussed previously). The following resources were used in calibrating the energy model:
Figure 8 – Energy Model Calibration It should also be noted that the building’s cogeneration plant was undergoing maintenance in May through July. These outages were deemed atypical; consequently, the calibrated energy model ignores this anomaly and was programed to match natural gas consumption during a typical year when the cogeneration plant is fully operational. Create the Baseline Energy ModelTo create a “baseline” model to serve as a starting point for further E/CRM modeling, the calibrated model was altered as follows:
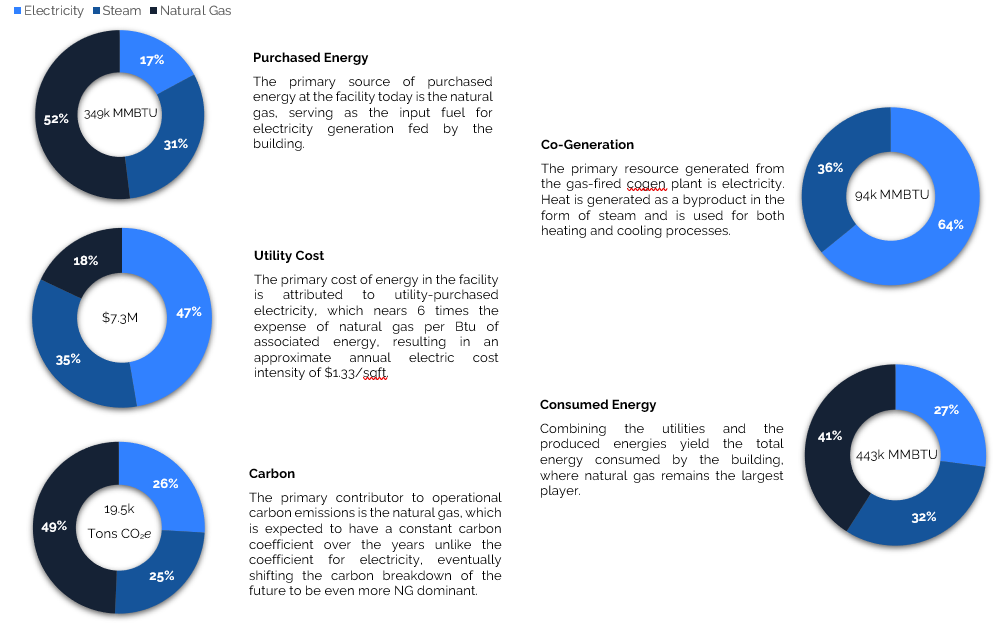
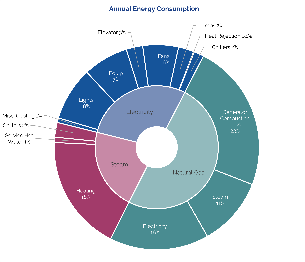
Generate Detailed End-Use Breakdowns - The baseline energy model outputs were utilized to determine the annual distribution of energy across building end uses. This analysis allowed the team to determine where there were opportunities for improvement.
Figure 9 – Annual End Use Breakdown
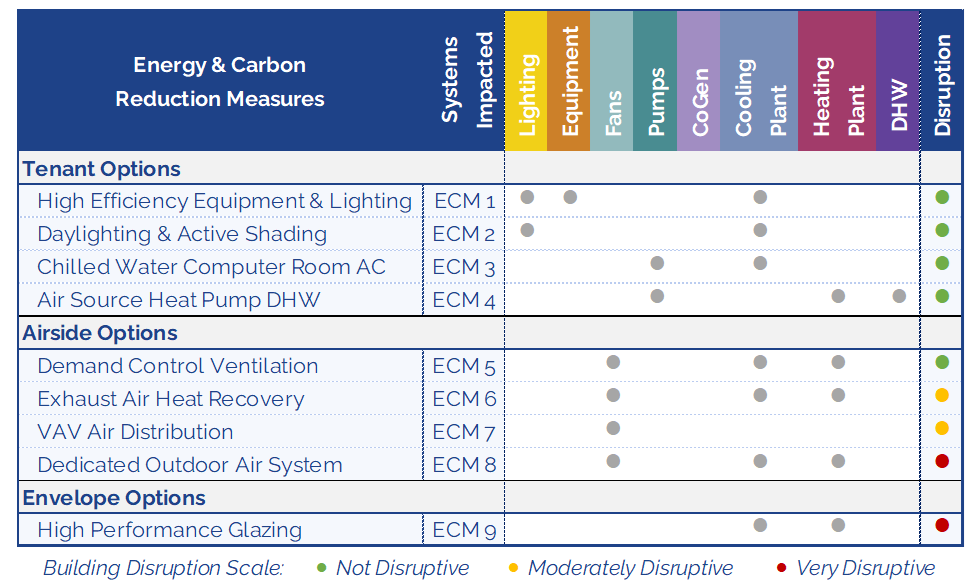
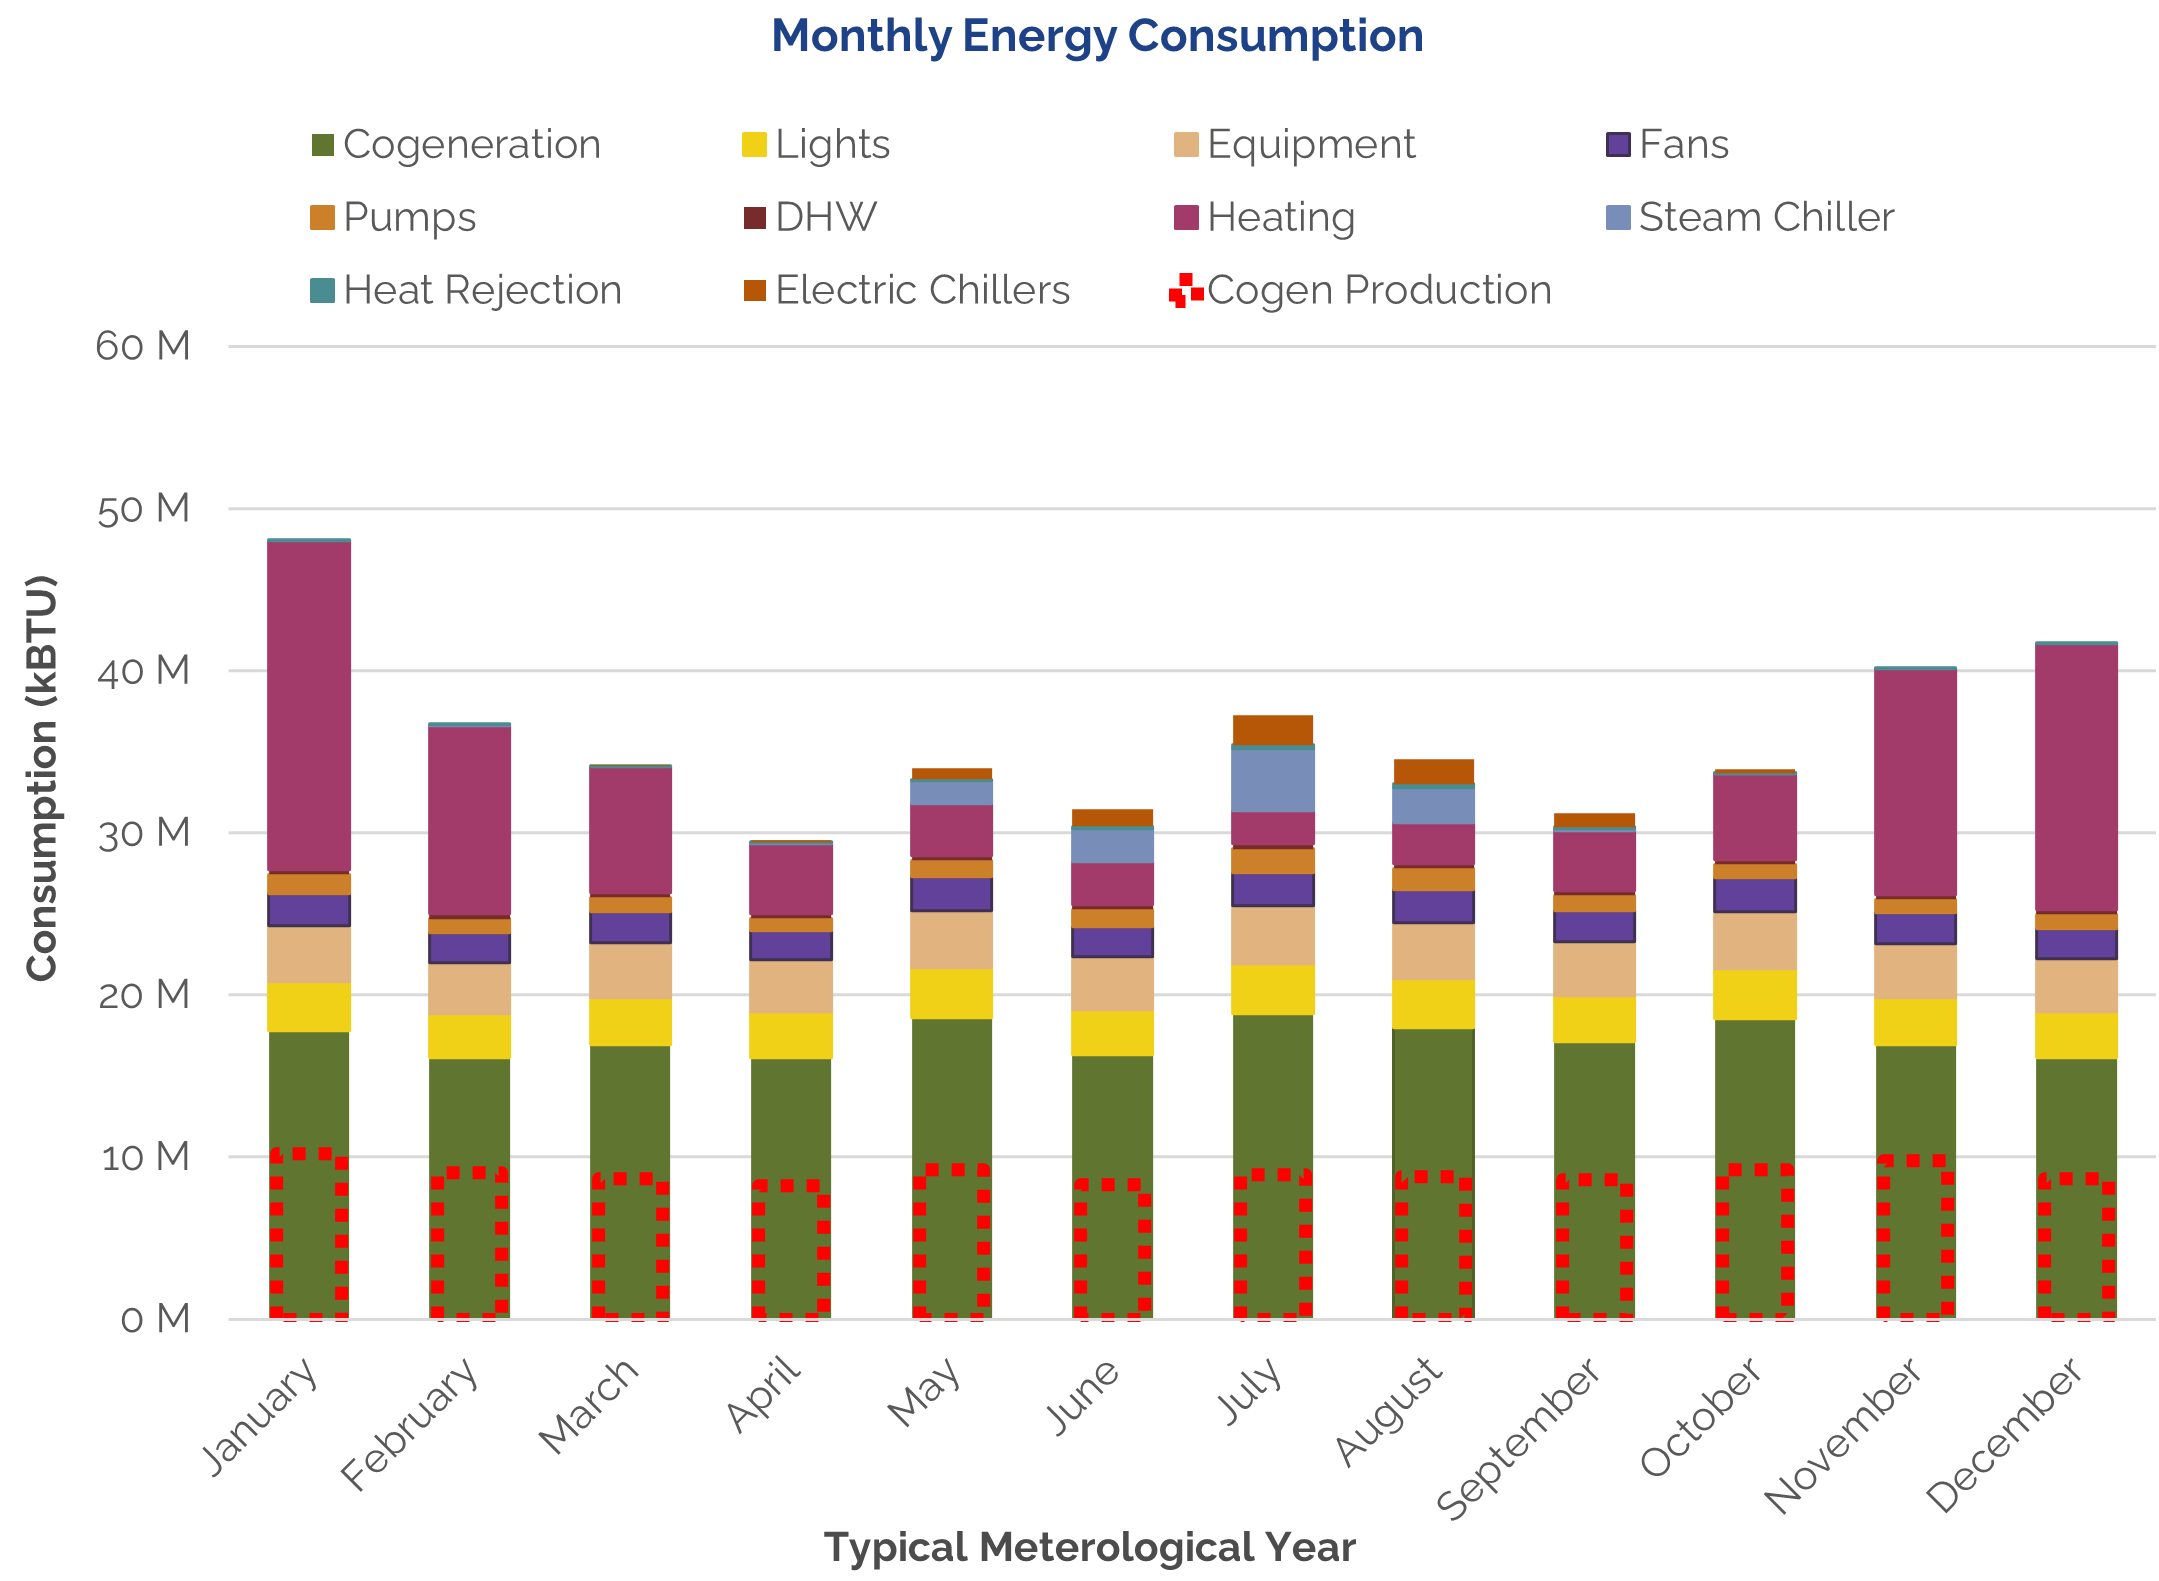
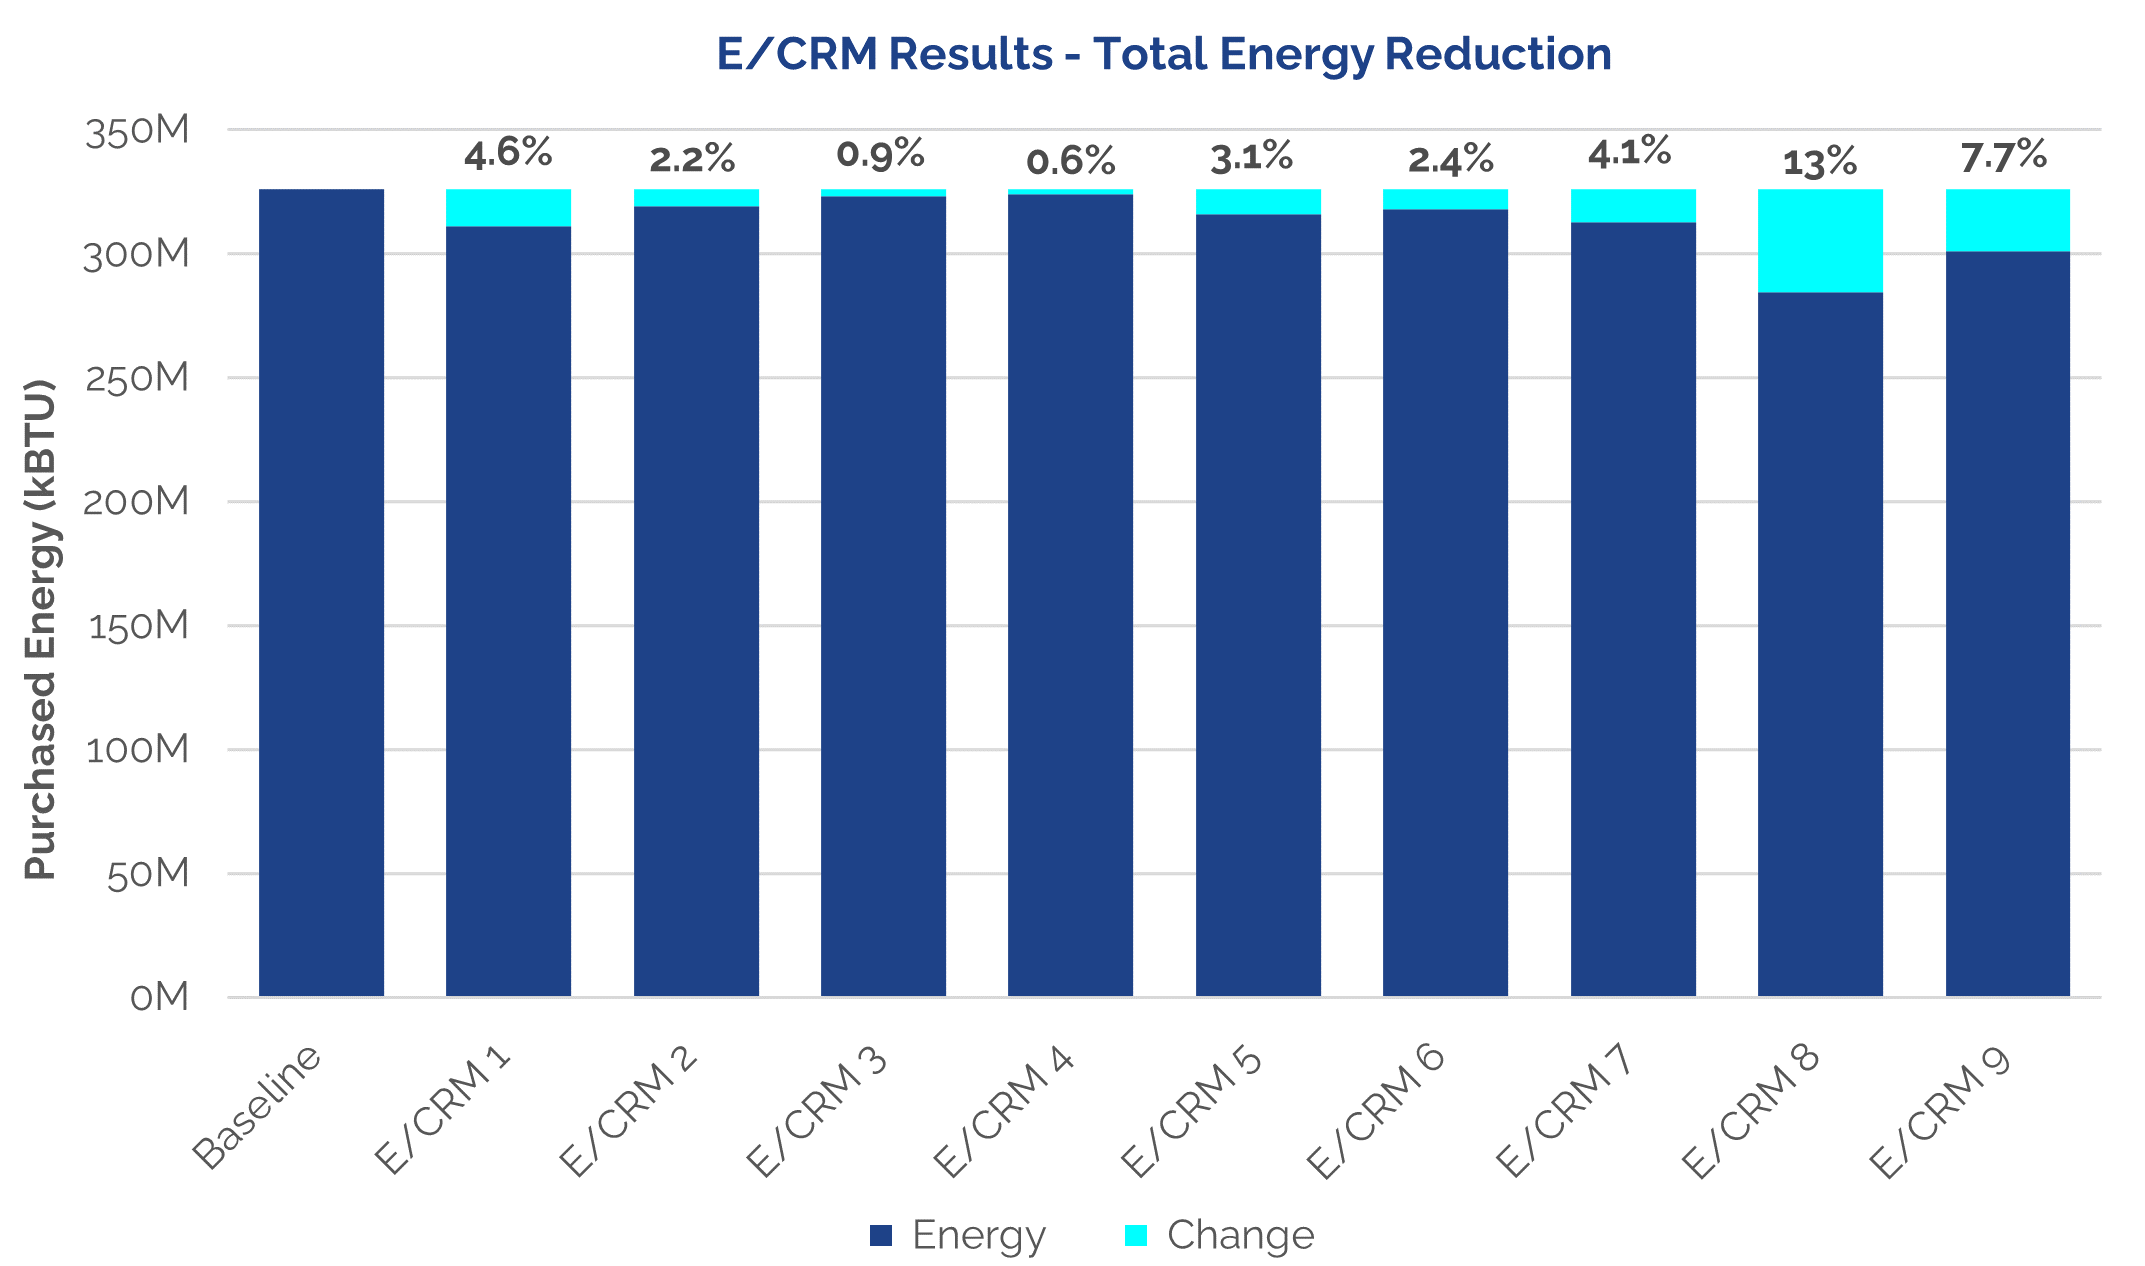
Figure 10 – Monthly Energy Breakdown by End Use Analyze Individual ECMsDuring the study, the project team identified nine (9) decarbonization strategies the building could undertake over the next 10-15 years. The energy modeler analyzed the ECMs through the baseline energy model to extract the associated energy, carbon and cost savings. As examples, below is a list of a few ECMs that the project team studied, with details on the energy modeling methodology used.
Figure 11 & 12 – Individual Energy and Carbon Reduction Measure Results Group, Sequence, and Package ECMsThe project team initially explored two (2) packages of combined reduction measures to assess the impact of eliminating fossil fuels and electrifying the building’s heating end uses. Individual measures studied earlier in the project were selected and combined with additional infrastructure enhancements to develop two electrification packages summarized as follows:
The packages are comprised of the following measures:
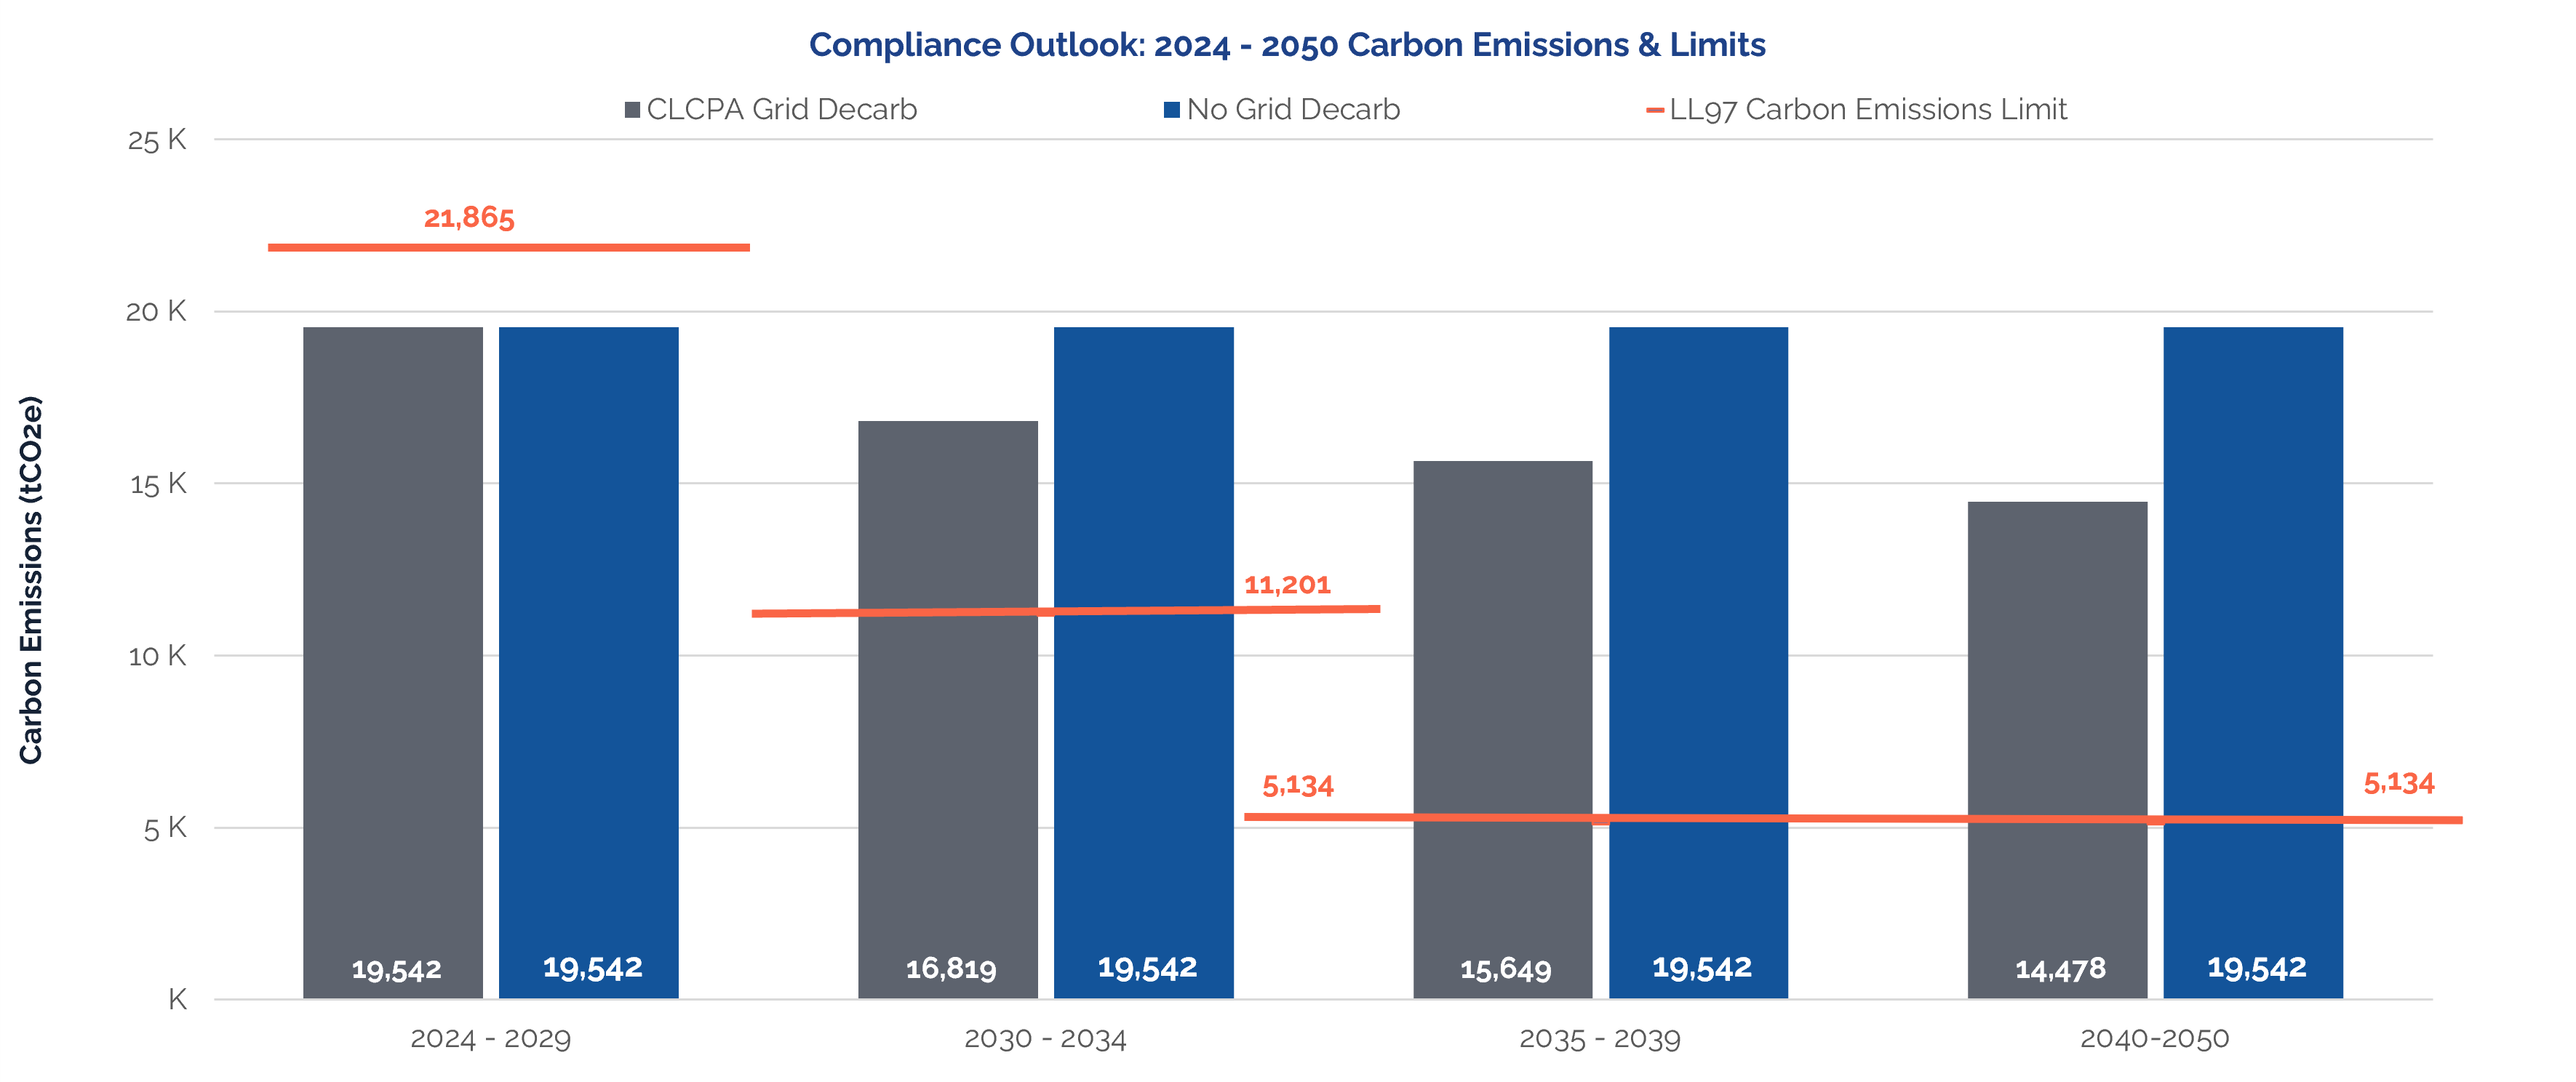
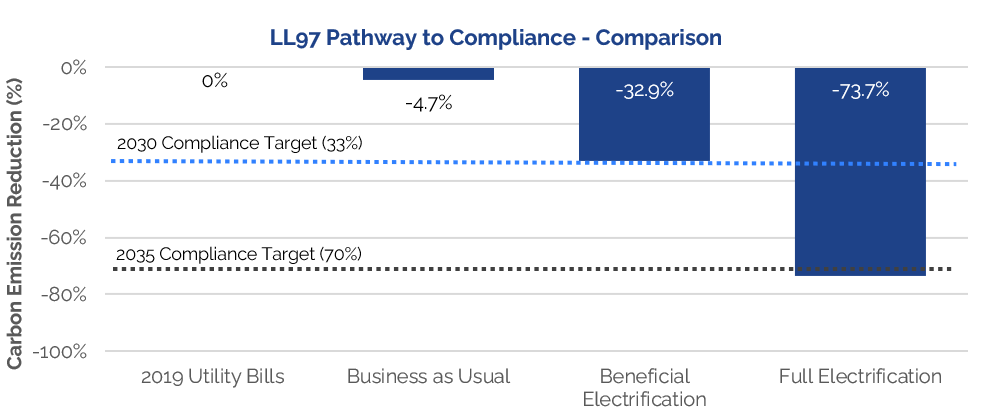
The Full Electrification package created the best scenario for PENN 1 to become carbon neutral by 2040, with the assumption that the grid is decarbonized per the CLCPA requirements; however, the Beneficial Electrification package offered a more favorable financial outlook that could be more feasibly attained in the near term.
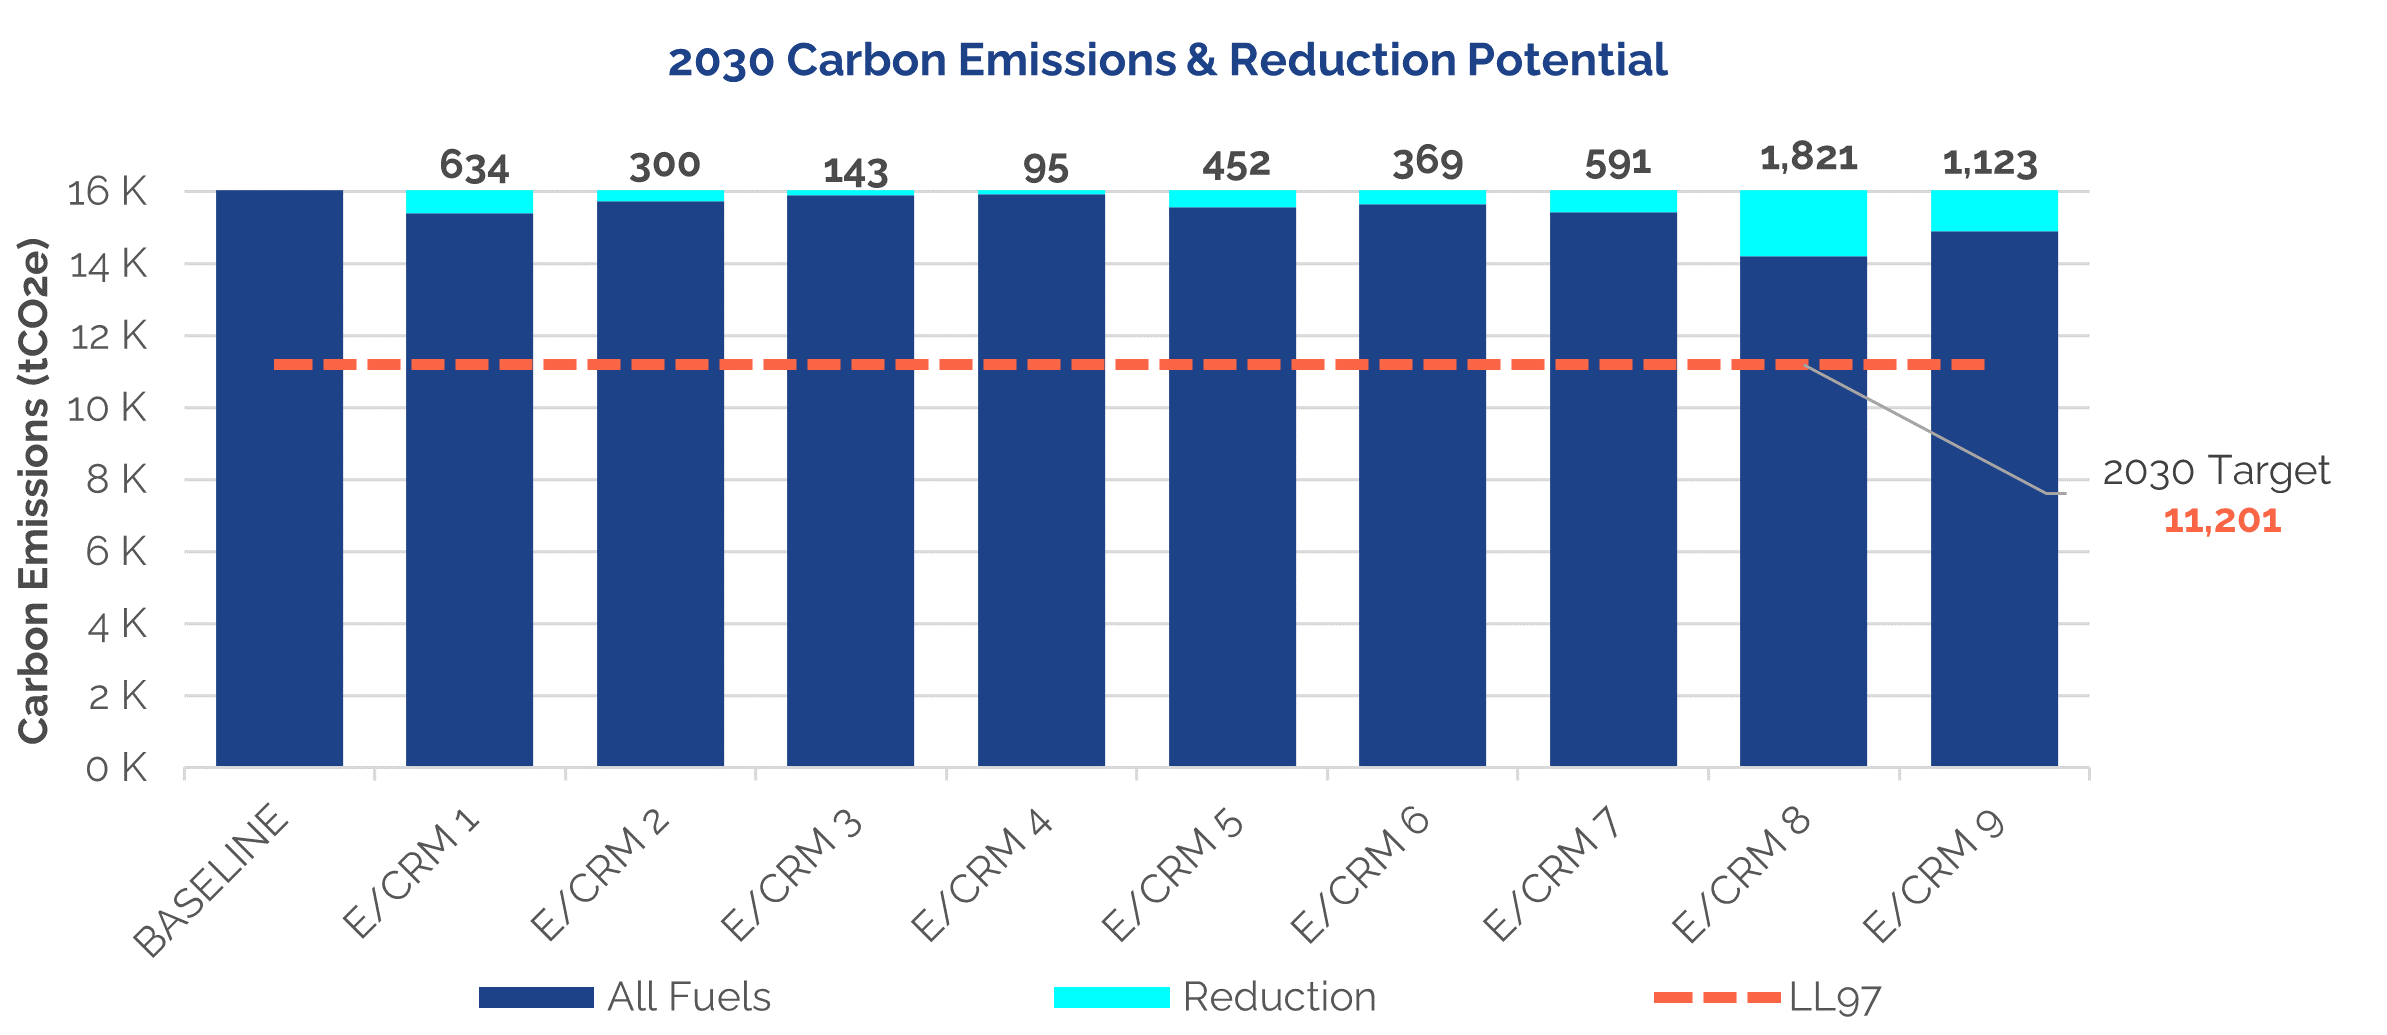
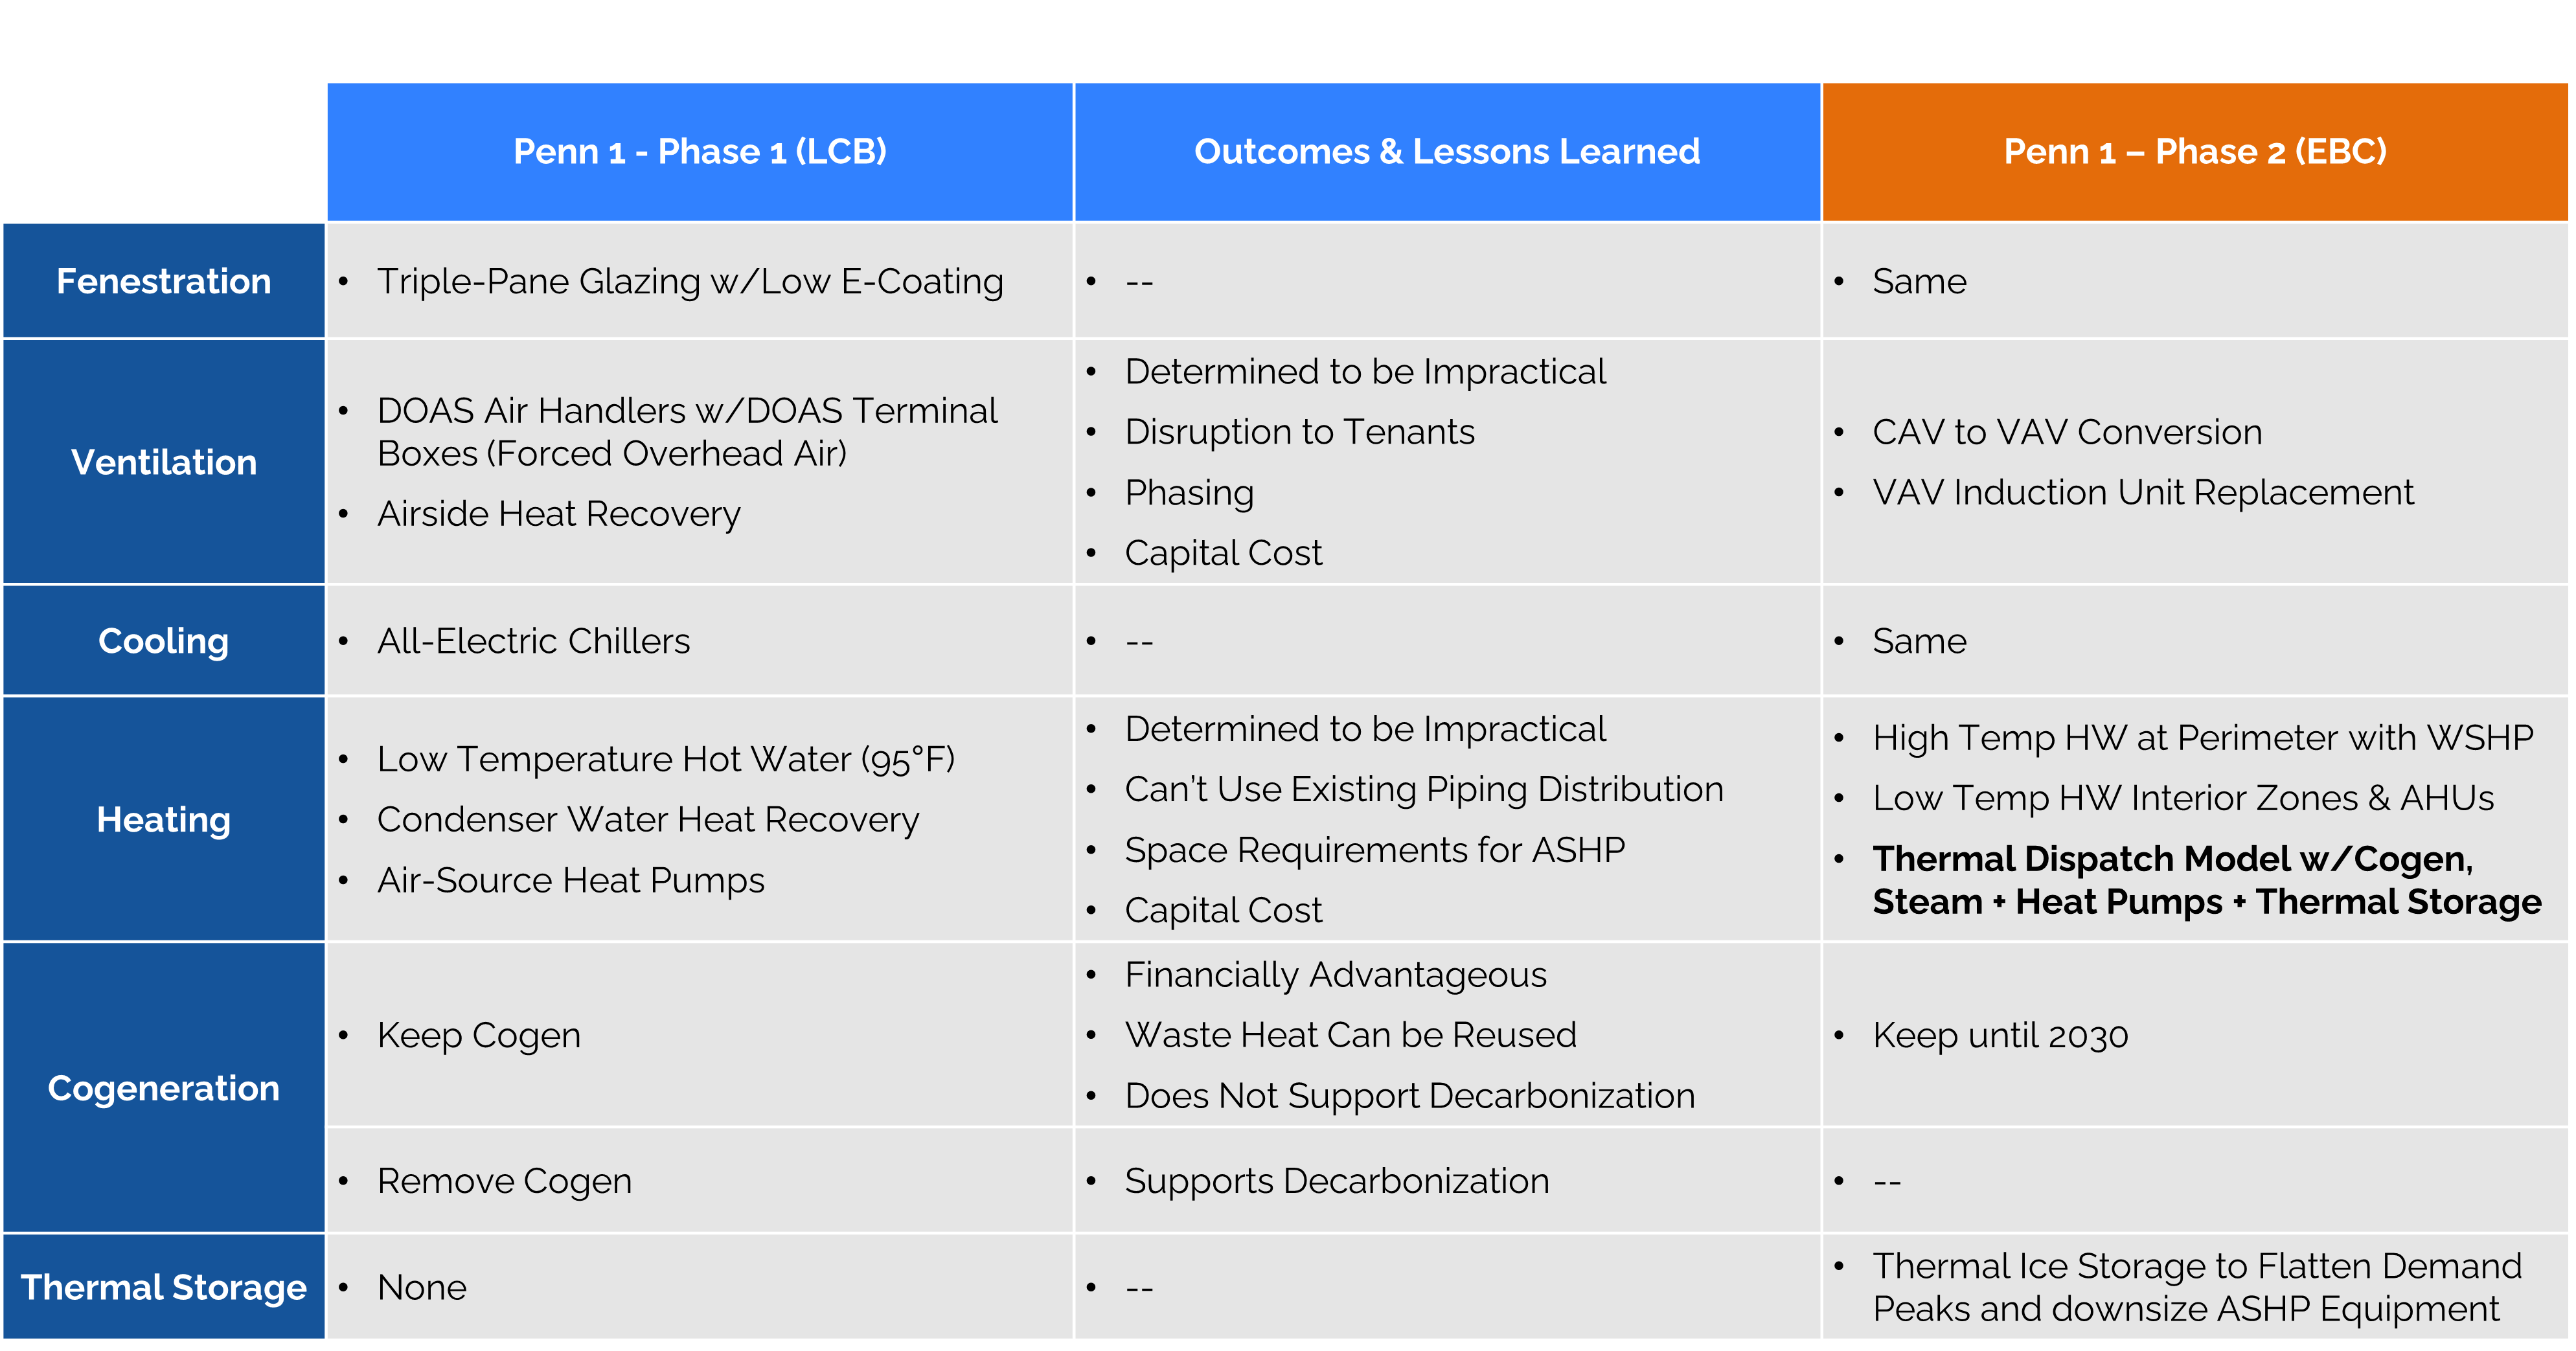
Figure 13 & 14 – Emissions Reductions & LL97 Impact with Electrification Packages Establish the Final List of ECMs – The project team presented the electrification package results to a various stakeholders within Vornado, and while everyone agreed that that the initial set of ECMs would produce deep carbon emissions reductions, there were certain strategies that were deemed impractical after preliminary capital cost estimates were obtained.
Figure 15 – Phase 1 vs Phase 2 ECMs At this point, the project team shifted its approach to the project. The team re-evaluated individual ECMs and electrification packages and adjusted measures to align with the following guiding principles:
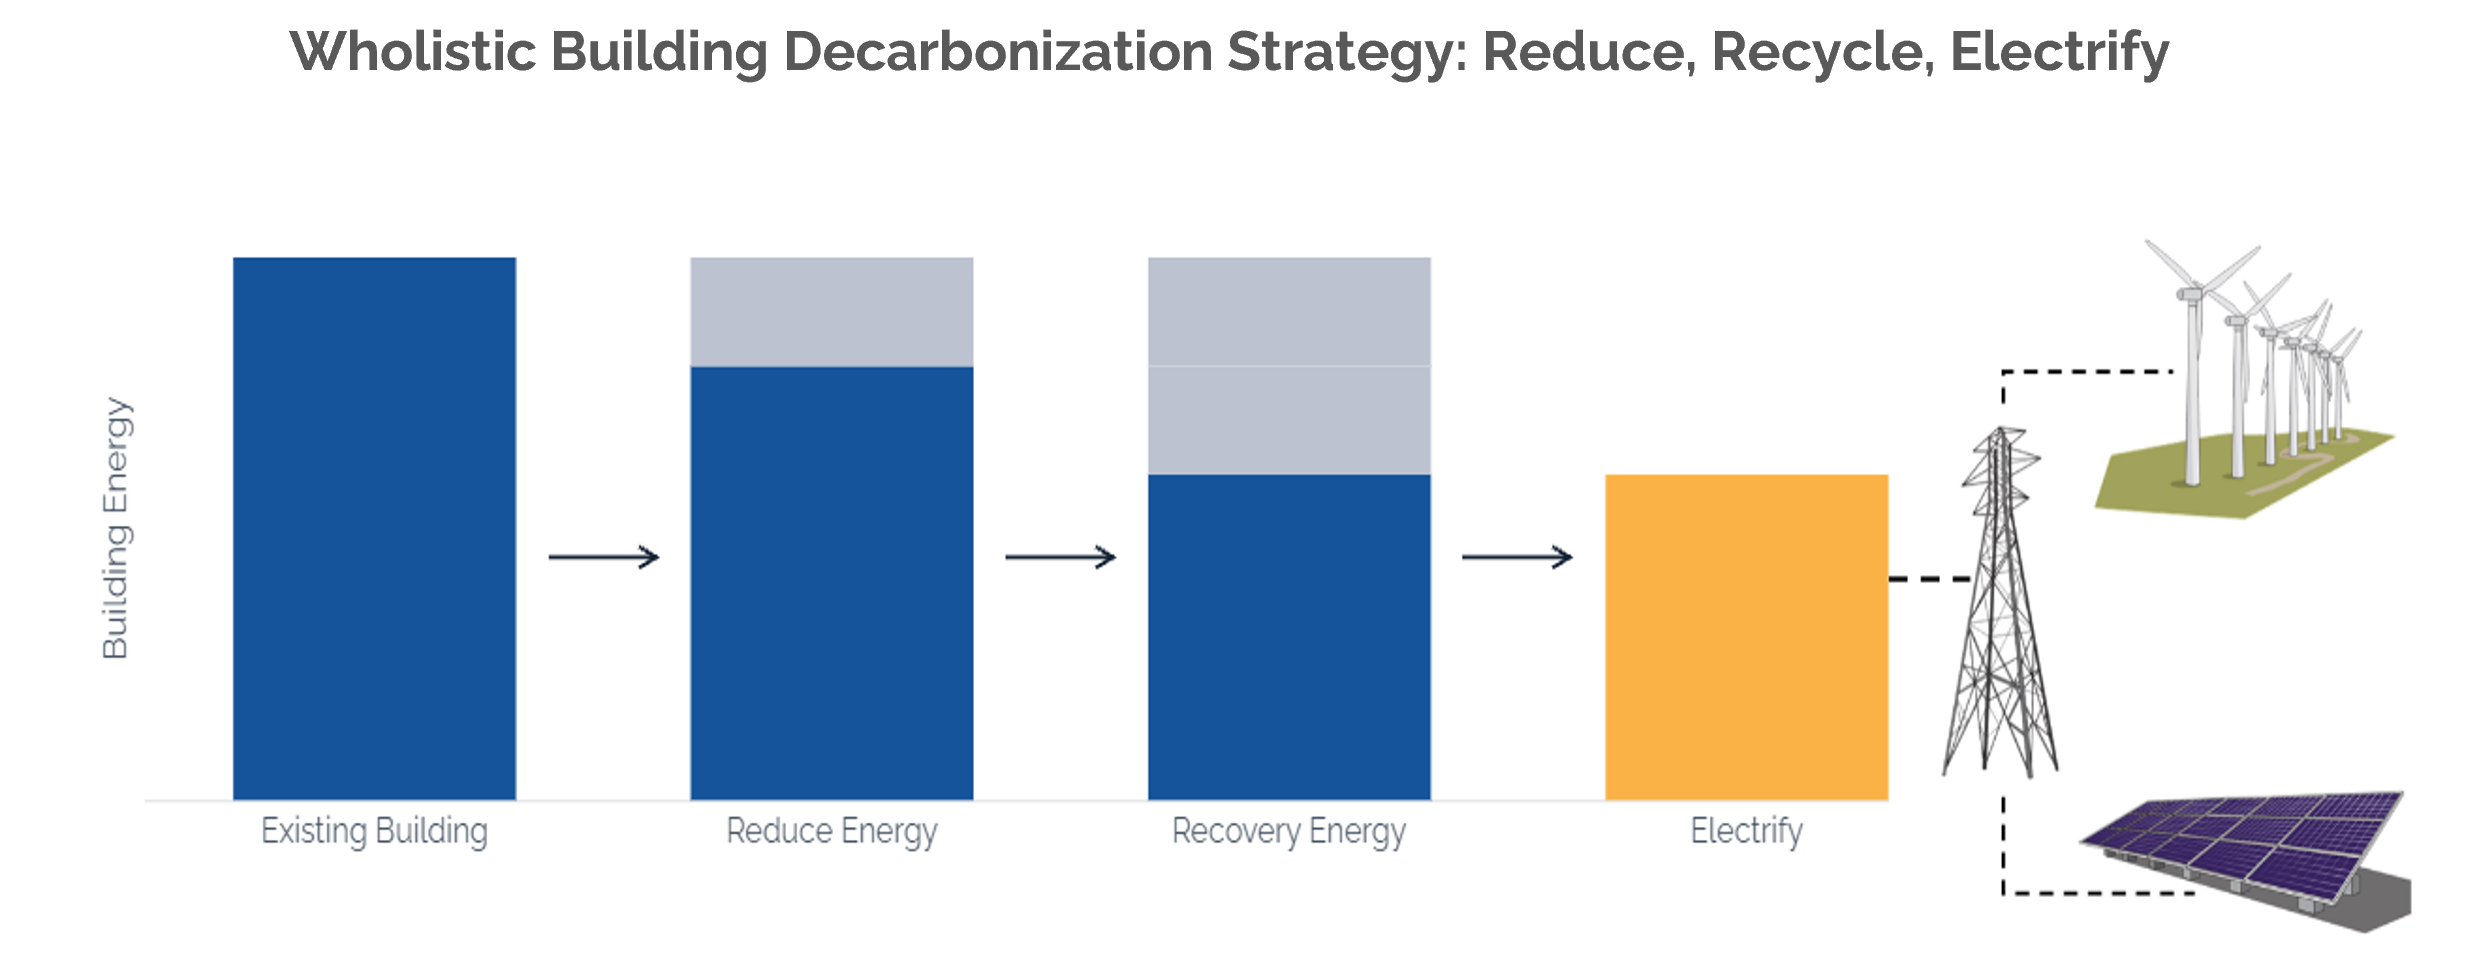
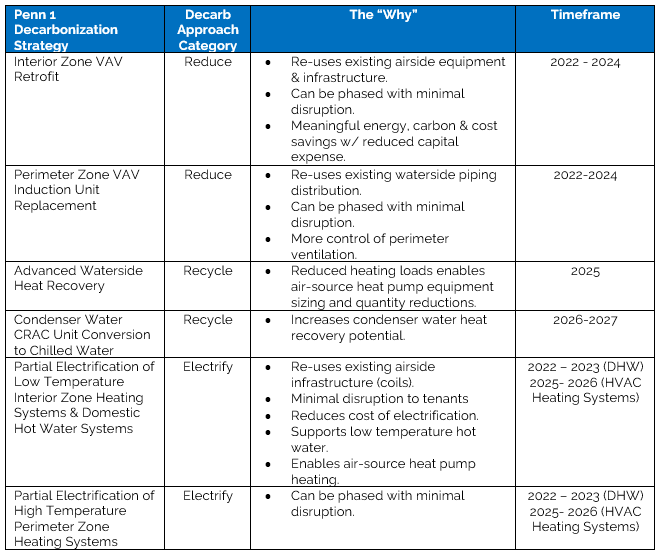
In addition, the team dialed in on the most impactful phasing of strategies to reduce capital costs, space requirements and infrastructure demand impacts through a Reduce, Recycle, Electrify framework.
Figure 16 – Resource Efficient Electrification Approach
The team generated a thermal dispatch model to optimize how the building’s loads are satisfied. The figure below shows how the various Phase II ECMs are deployed to meet the building’s heating demand on a winter day. Instead of eliminating steam and the cogeneration plan immediately, the team settled on a more measured approach which uses some district steam and cogen waste heat in the short term to avoid stranded assets, and then shifts to a substantially electrified building in the 2030 -2035-time frame.
Figure 17 – Thermal Dispatch Model Generate a Decarbonization RoadmapOnce the finalized phase II ECMs were packaged, the energy model was run for each ECM package to obtain energy and carbon and cost impacts. The project team compared the results of this analysis and calculated the energy and carbon savings from the baseline model.
Figure 18 – Finalized ECMs & Packages
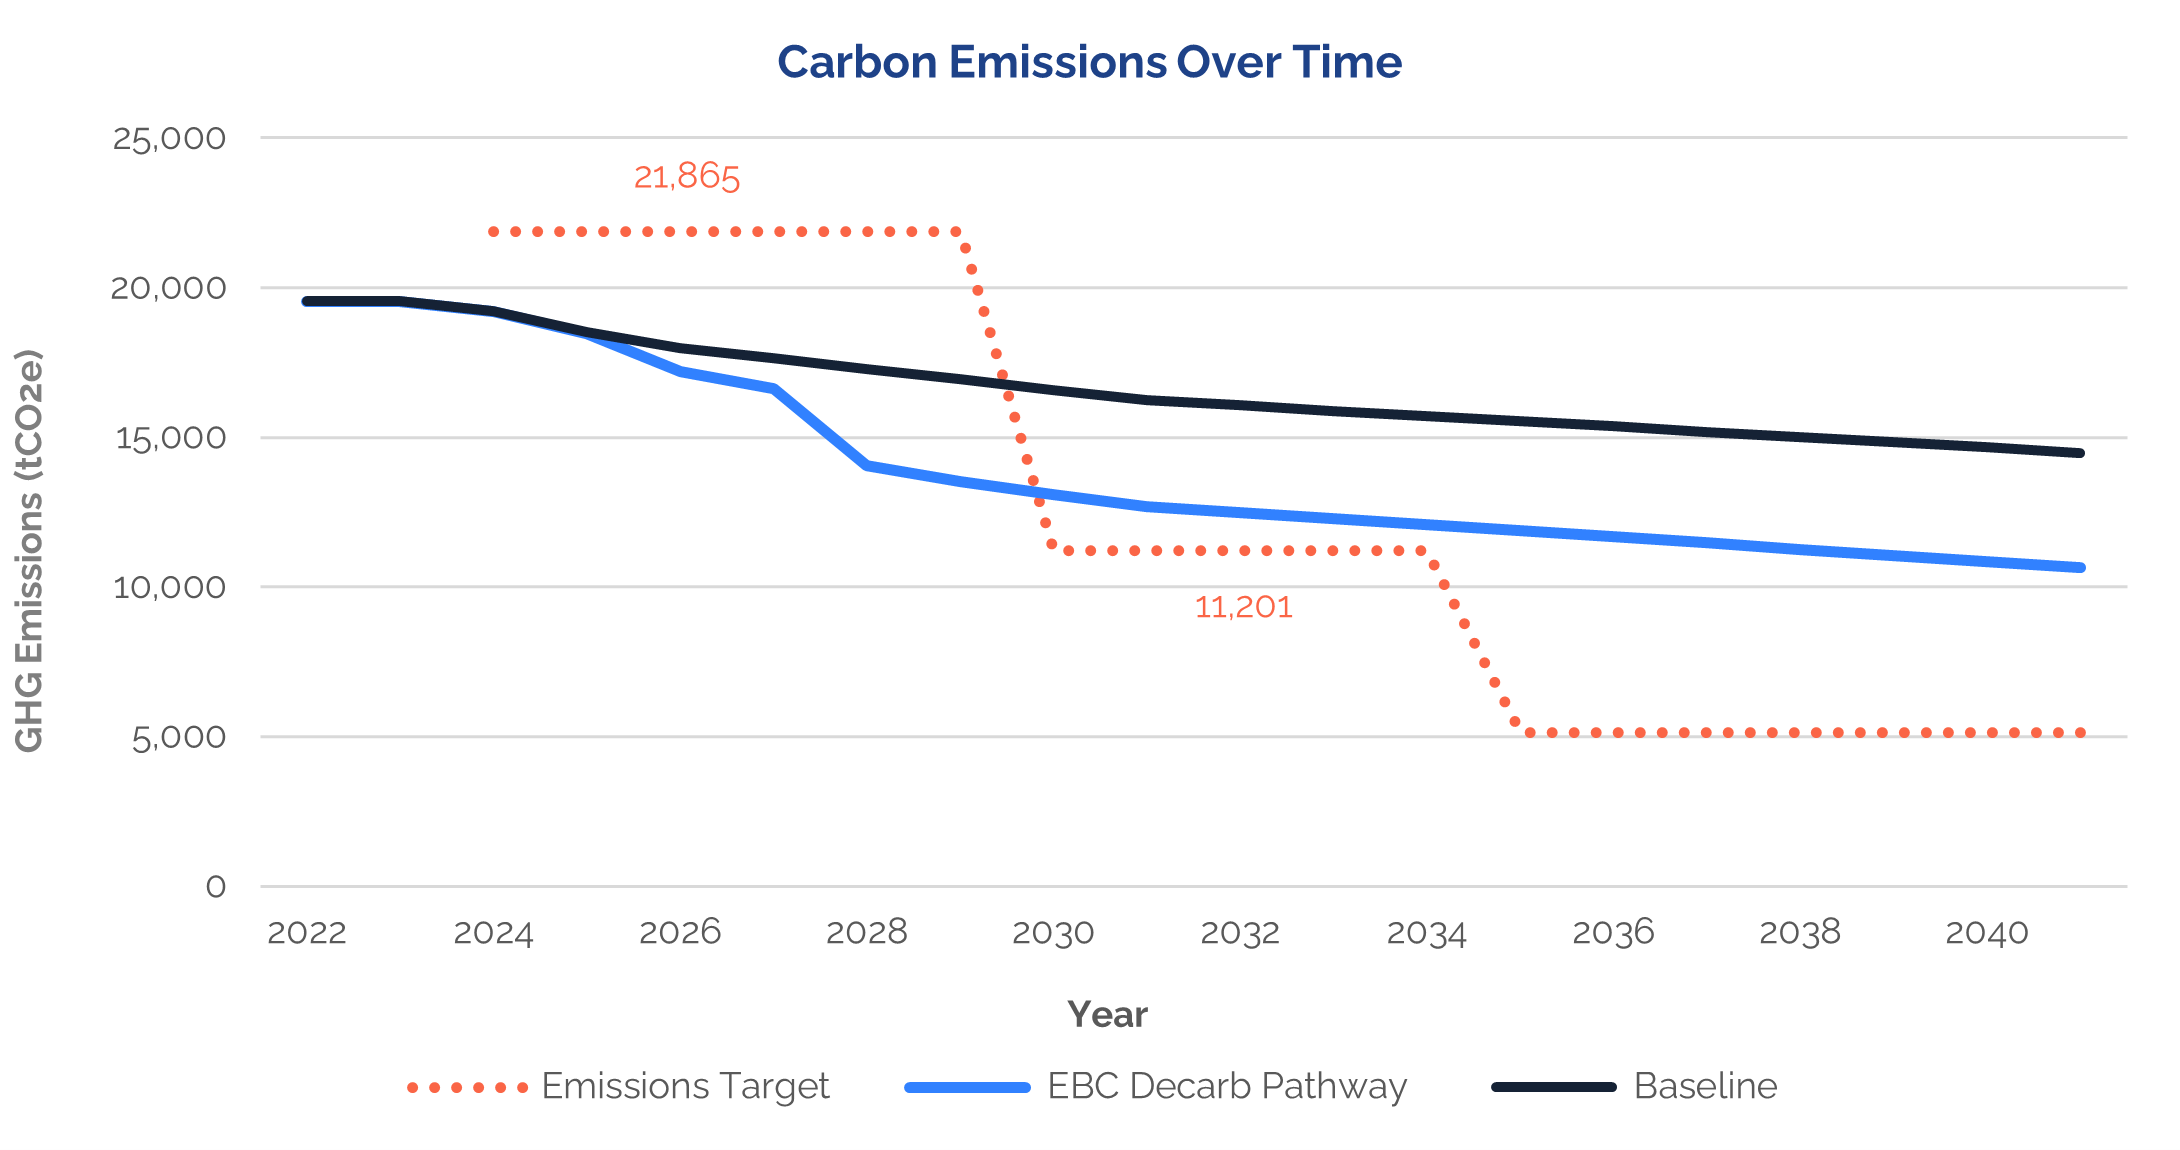
Figure 19 – Deep Decarbonization Pathway |


| HTML |
|---|
</script>  <style type="text/css">
.innerCell .aura-panel-14e20dce56b3d533 {
margin-top:0px!important;
margin-bottom:0px!important;
margin-left:0px!important;
margin-right:0px!important;
} </style> |

| Aura - Background Content | ||||||||||||||||||||||||||||||||||||
|---|---|---|---|---|---|---|---|---|---|---|---|---|---|---|---|---|---|---|---|---|---|---|---|---|---|---|---|---|---|---|---|---|---|---|---|---|
| ||||||||||||||||||||||||||||||||||||
|
| Aura - Panel | |||||||||||
|---|---|---|---|---|---|---|---|---|---|---|---|
| |||||||||||
|
| Aura - Panel | ||||||
|---|---|---|---|---|---|---|
| ||||||
|
| Aura - Panel | ||||||
|---|---|---|---|---|---|---|
| ||||||
| Aura - Panel | |||||||||||||||||||||||||||||||
|---|---|---|---|---|---|---|---|---|---|---|---|---|---|---|---|---|---|---|---|---|---|---|---|---|---|---|---|---|---|---|---|
| |||||||||||||||||||||||||||||||
Vornado Realty Trust (VNO) and their team of consultants shown above, followed the Playbook approach to define the decarbonization roadmap for PENN 1. The iconic midcentury building consists of 57 stories totaling 2.5 million gross square feet.
|
| Aura - Panel | ||||||
|---|---|---|---|---|---|---|
| ||||||
Getting StartedThe Vornado sustainability team, in collaboration with the PENN 1 building management team, assembled a project team with deep expertise across multiple disciplines that could address the level of complexity, interdisciplinary thinking, and innovation needed to develop a decarbonization roadmap for PENN 1. The core project team consisted of:
At the onset of the project, the team took an aggressive approach to building decarbonization, and focused on eliminating all dependence on district steam and natural gas. The following guiding questions were used in this first round of analysis:
Later in the project, after an initial round of analysis and results, the project team re-evaluated and adjusted the approach to decarbonizing the building. A new set of guiding questions were developed as the study entered a second phase:
|
| Aura - Panel | ||||||
|---|---|---|---|---|---|---|
| ||||||
Building DiscoveryLearn the BuildingThe project team collected, studied and analyzed several key pieces of information over the study period, including:
To keep information organized, the JB&B team deployed a checklist of requested documentation with clear indication of each item’s importance to the development of the building’s calibrated energy model. The JB&B Team also developed a questionnaire that was used to guide discussions with the building’s operations team during building walkthroughs and surveys
Figure 1: Sample Facility Data Collection Checklists |
| Aura - Panel | |||||||||
|---|---|---|---|---|---|---|---|---|---|
| |||||||||
Energy & Carbon ModelingBuild and Calibrate the Initial Energy ModelThe initial energy model was developed using the graphical interface DesignBuilder® with EnergyPlus as the calculation and simulation engine. Building attributes such as floor dimensions, lighting, plug loads, HVAC layouts, and detailed schedules were included in the model to reflect the general parameters of the existing building conditions.
Figure 7 – Energy Model Renderings Through an iterative process, the energy model inputs were modified to align the calculated energy model outputs with actual building utility data (sample compound years as discussed previously). The following resources were used in calibrating the energy model:
Figure 8 – Energy Model Calibration It should also be noted that the building’s cogeneration plant was undergoing maintenance in May through July. These outages were deemed atypical; consequently, the calibrated energy model ignores this anomaly and was programed to match natural gas consumption during a typical year when the cogeneration plant is fully operational. Create the Baseline Energy ModelTo create a “baseline” model to serve as a starting point for further E/CRM modeling, the calibrated model was altered as follows:
Generate Detailed End-Use Breakdowns - The baseline energy model outputs were utilized to determine the annual distribution of energy across building end uses. This analysis allowed the team to determine where there were opportunities for improvement.
Figure 9 – Annual End Use Breakdown
Figure 10 – Monthly Energy Breakdown by End Use Analyze Individual ECMsDuring the study, the project team identified nine (9) decarbonization strategies the building could undertake over the next 10-15 years. The energy modeler analyzed the ECMs through the baseline energy model to extract the associated energy, carbon and cost savings. As examples, below is a list of a few ECMs that the project team studied, with details on the energy modeling methodology used.
Figure 11 & 12 – Individual Energy and Carbon Reduction Measure Results Group, Sequence, and Package ECMsThe project team initially explored two (2) packages of combined reduction measures to assess the impact of eliminating fossil fuels and electrifying the building’s heating end uses. Individual measures studied earlier in the project were selected and combined with additional infrastructure enhancements to develop two electrification packages summarized as follows:
The packages are comprised of the following measures:
The Full Electrification package created the best scenario for PENN 1 to become carbon neutral by 2040, with the assumption that the grid is decarbonized per the CLCPA requirements; however, the Beneficial Electrification package offered a more favorable financial outlook that could be more feasibly attained in the near term.
Figure 13 & 14 – Emissions Reductions & LL97 Impact with Electrification Packages Establish the Final List of ECMs – The project team presented the electrification package results to a various stakeholders within Vornado, and while everyone agreed that that the initial set of ECMs would produce deep carbon emissions reductions, there were certain strategies that were deemed impractical after preliminary capital cost estimates were obtained.
Figure 15 – Phase 1 vs Phase 2 ECMs At this point, the project team shifted its approach to the project. The team re-evaluated individual ECMs and electrification packages and adjusted measures to align with the following guiding principles:
In addition, the team dialed in on the most impactful phasing of strategies to reduce capital costs, space requirements and infrastructure demand impacts through a Reduce, Recycle, Electrify framework.
Figure 16 – Resource Efficient Electrification Approach
The team generated a thermal dispatch model to optimize how the building’s loads are satisfied. The figure below shows how the various Phase II ECMs are deployed to meet the building’s heating demand on a winter day. Instead of eliminating steam and the cogeneration plan immediately, the team settled on a more measured approach which uses some district steam and cogen waste heat in the short term to avoid stranded assets, and then shifts to a substantially electrified building in the 2030 -2035-time frame.
Figure 17 – Thermal Dispatch Model Generate a Decarbonization RoadmapOnce the finalized phase II ECMs were packaged, the energy model was run for each ECM package to obtain energy and carbon and cost impacts. The project team compared the results of this analysis and calculated the energy and carbon savings from the baseline model.
Figure 18 – Finalized ECMs & Packages
Figure 19 – Deep Decarbonization Pathway |
| HTML |
|---|
</script>  <style type="text/css">
.innerCell .aura-panel-14e20dce56b3d533 {
margin-top:0px!important;
margin-bottom:0px!important;
margin-left:0px!important;
margin-right:0px!important;
} </style> |