| Panel | |||||
|---|---|---|---|---|---|
| |||||
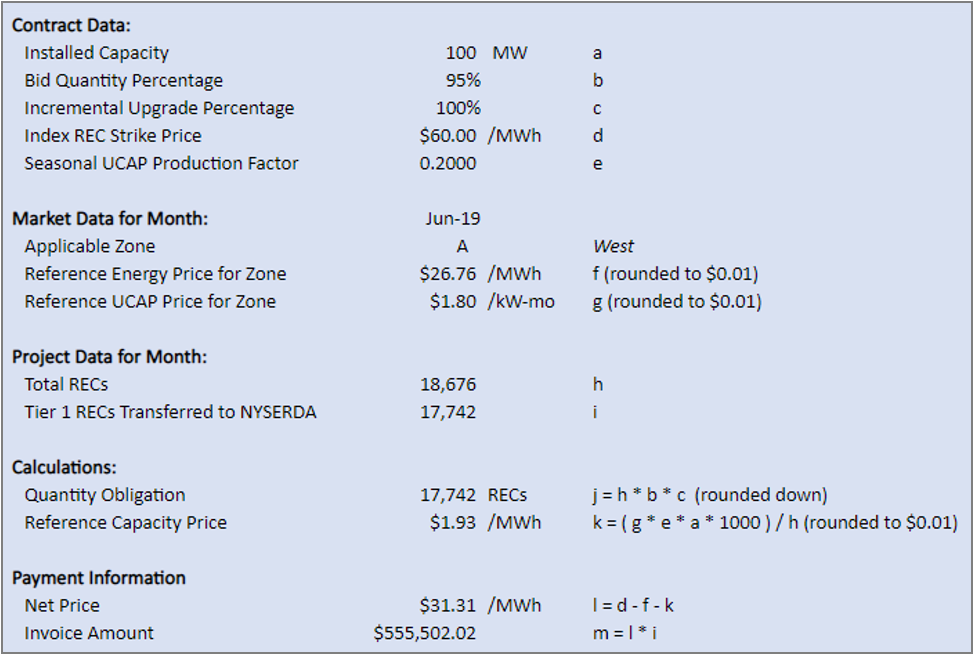
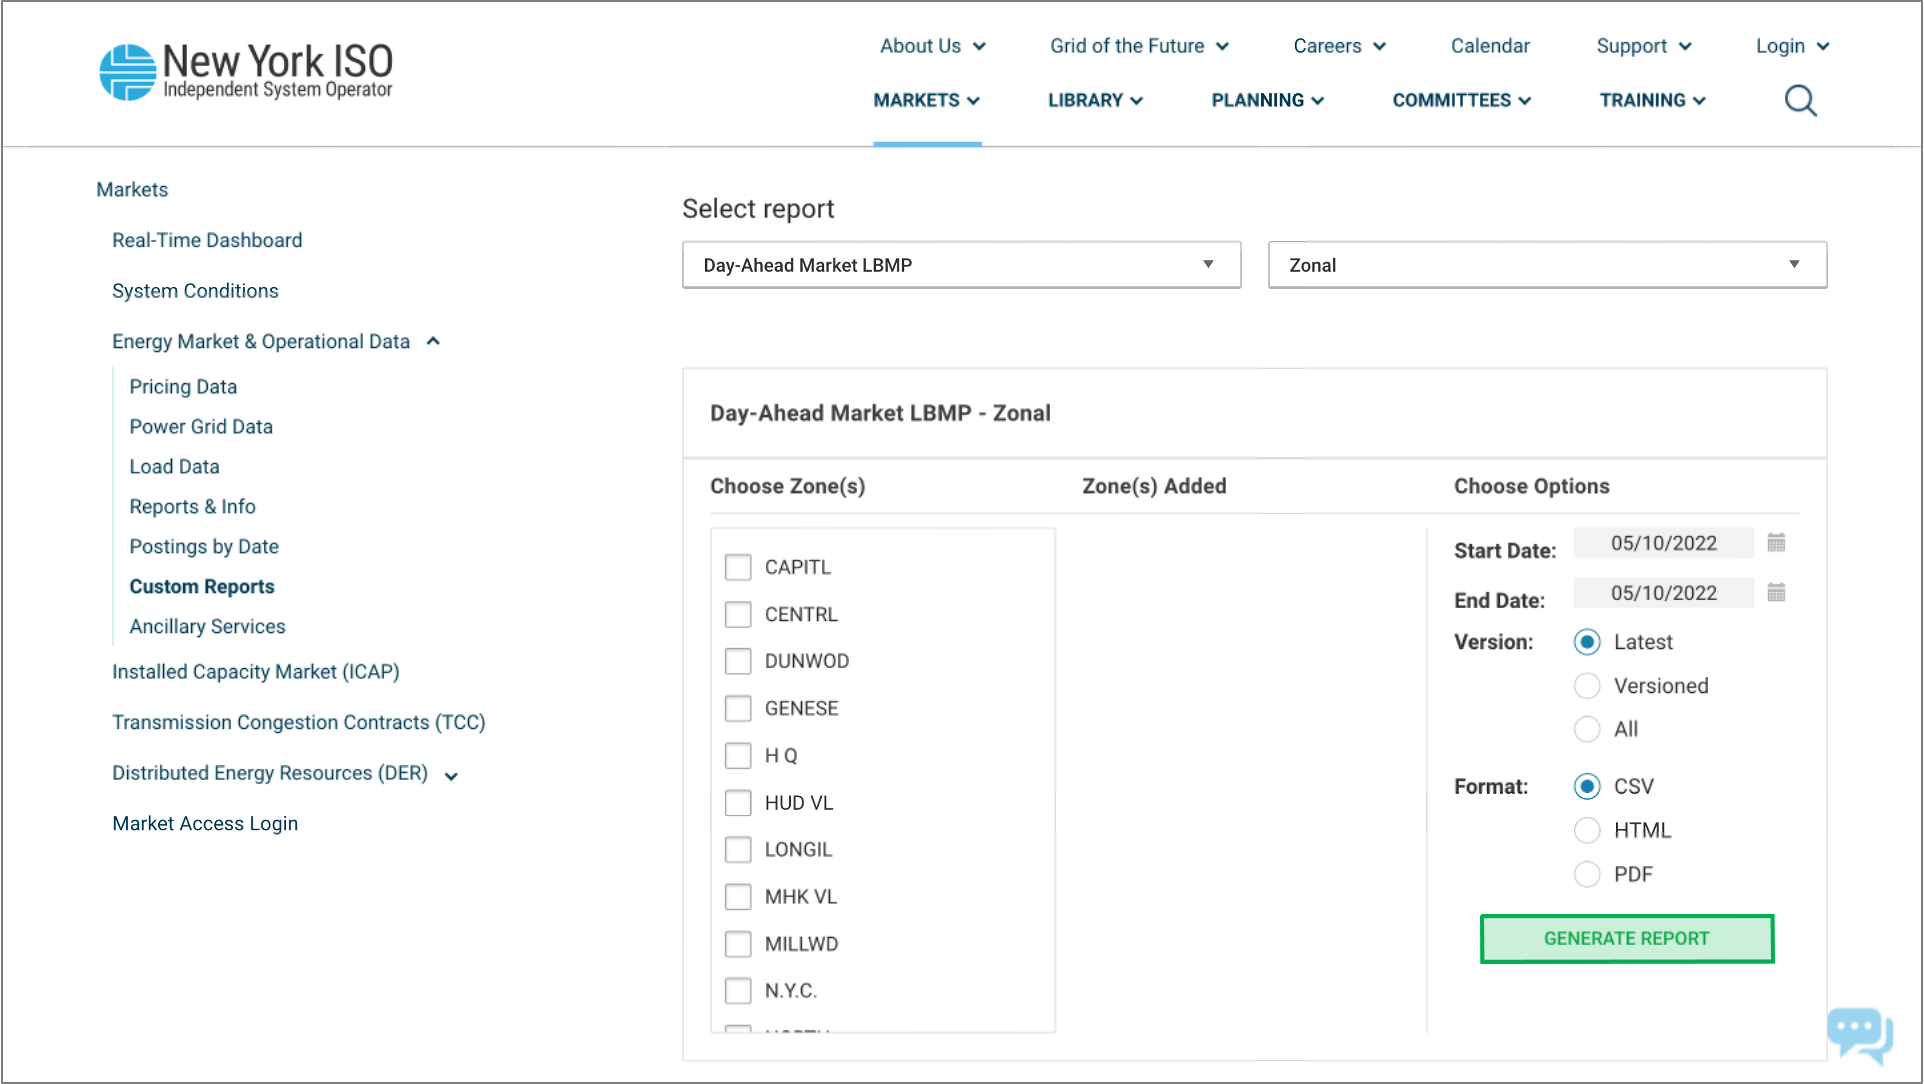
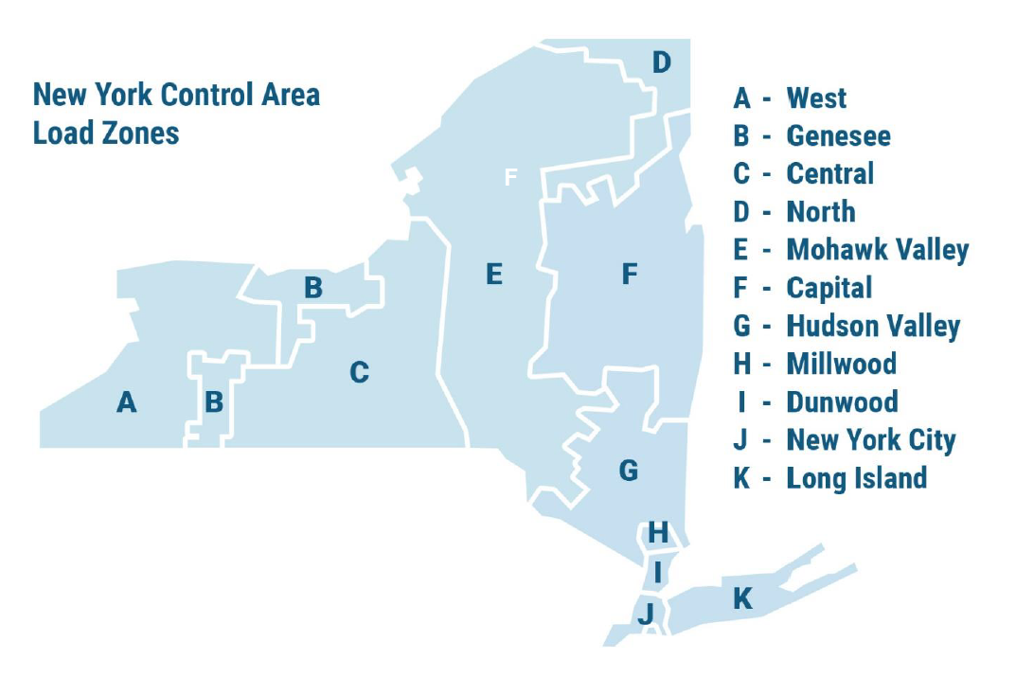
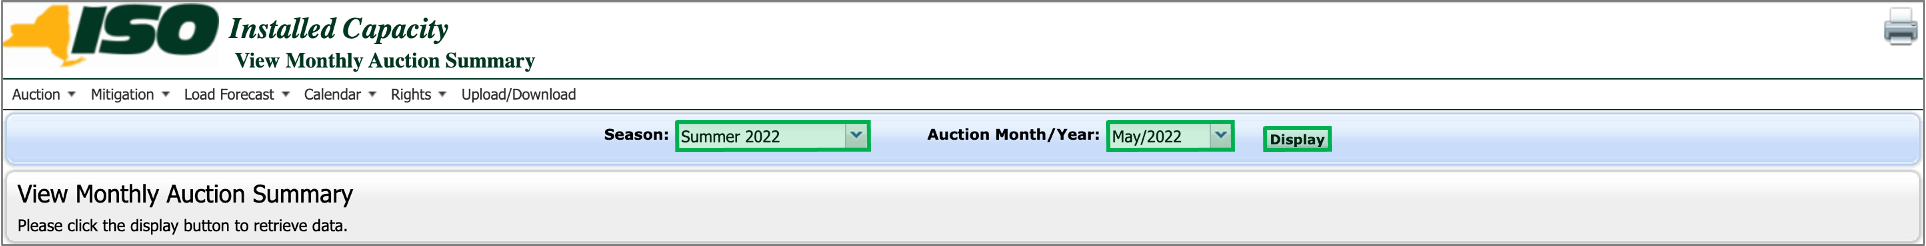
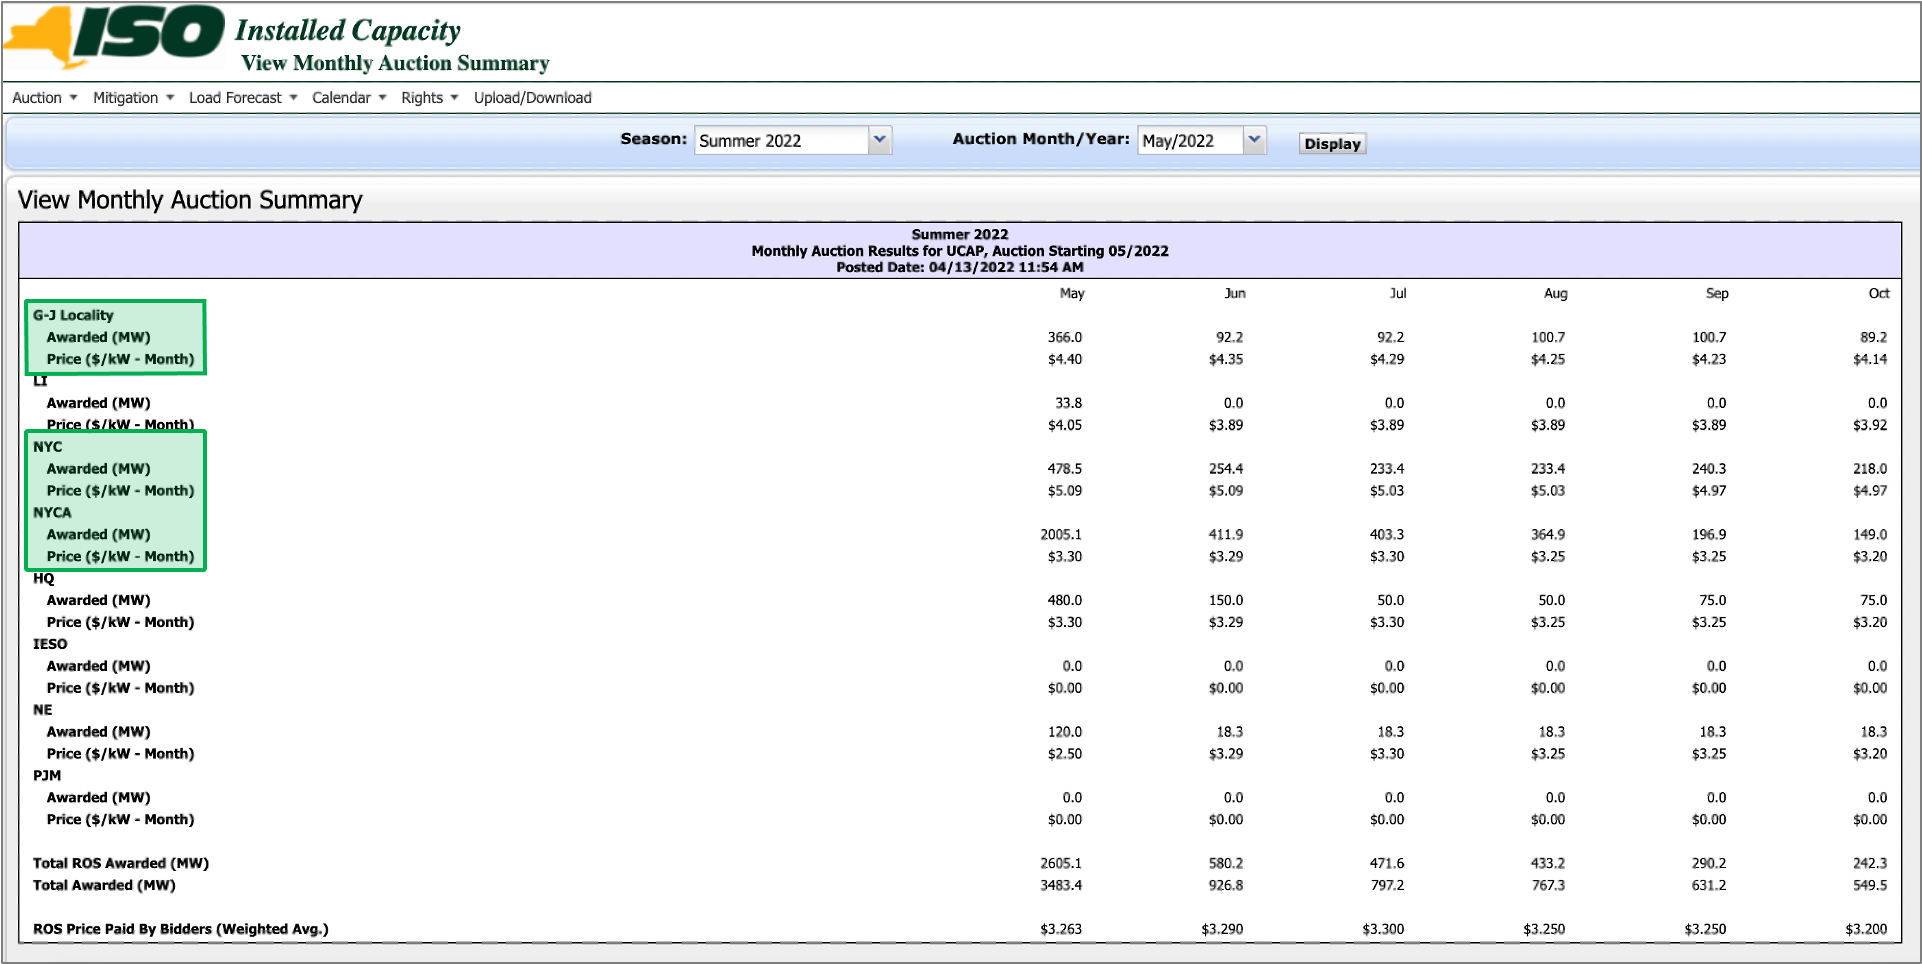
IntroductionThis page provides an overview of the REC Index pricing structure and inputs for calculations using data from the NYSERDA Agreement, NYISO, and NYGATS.
|
| Aura - Panel | |||||||||||||||||||||||||||||||||||||||||||||||||||||||||||||
|---|---|---|---|---|---|---|---|---|---|---|---|---|---|---|---|---|---|---|---|---|---|---|---|---|---|---|---|---|---|---|---|---|---|---|---|---|---|---|---|---|---|---|---|---|---|---|---|---|---|---|---|---|---|---|---|---|---|---|---|---|---|
| |||||||||||||||||||||||||||||||||||||||||||||||||||||||||||||
|
| Aura - Panel | ||||||||||||||||||||||||||||||||||||||||||||||||||||||||||||||||||||||
|---|---|---|---|---|---|---|---|---|---|---|---|---|---|---|---|---|---|---|---|---|---|---|---|---|---|---|---|---|---|---|---|---|---|---|---|---|---|---|---|---|---|---|---|---|---|---|---|---|---|---|---|---|---|---|---|---|---|---|---|---|---|---|---|---|---|---|---|---|---|---|
| ||||||||||||||||||||||||||||||||||||||||||||||||||||||||||||||||||||||
| ||||||||||||||||||||||||||||||||||||||||||||||||||||||||||||||||||||||
| HTML |
|---|
<script type="text/javascript" >
   jQuery(document).ajaxComplete(function() {
      if(jQuery('.ia-fixed-sidebar.collapsed').length == 0 ) {
         jQuery('.expand-collapse-trigger').click();
     };
   });
</script> |