

Central systems may present more opportunities for optimization based on automation and controls sequences.
- High performance standards: Consistent rollout of high-performance standards is crucial:
- Key internal and external service providers (fit out designers, controls vendors, maintenance contractors, lease negotiators) require technical oversight to ensure all their work supports energy and carbon efficiency goals.
- Tenant designs: Small deviations of tenant designs from energy code and tenant design guidelines can build up to significant impediments to achieving carbon savings.
- Small decisions add up to big impact: Consider long-term ROI and operational consequences of first-cost decisions on all projects.


The Empire State Realty Trust and their team of consultants shown above, followed the Playbook approach to define the decarbonization roadmap for their flagship office building: the Empire State Building. The iconic landmark consists of 102 stories totaling 2.8 million gross square feet, among which 1.8 million square feet of rentable space.
TABLE OF CONTENTS
Getting Started
The ESRT management team took great care to assemble a project team with deep expertise that could handle the level of complexity, interdisciplinary thinking, and innovation needed to tackle the challenge of bringing the Empire State Building as close as possible to its carbon neutrality goal. The core project team consisted of:
- ESRT, building owner and facilities team
- Buro Happold Engineering, global leader in whole building systems engineering
- Quest Energy, energy modeling consultant
- Skanska, constructability and cost analysis consultant
- Luthin, grid, tariff, rate, tax, and carbon emissions fine (LL97) expertise
- Johnson Controls, BMS vendor and consultant
- Tabla Raza, external consultant specializing in innovative solutions with technology
- Reos Partners, facilitation and support of collaborative meetings
Additional support was provided by:
- Trystate Mechanical, mechanical contractor assisted in pricing ECMs
- Robert Clarke Associates, leading expert in the application of architectural glass technology to sustainable design
- Mosto Technologies, energy consult specializing in commercial steam systems in NYC
- Sentient Buildings, energy management consultant providing real-time building automation that enables advanced monitoring and management solutions
- Cortex, energy management consultant providing real-time energy monitoring software and system recommendations
- US Chillers, global chiller and energy solutions provider
- Lutron, leading expert in lighting design
- Sapient, external consultant specializing in plug load management
- Wint, water management consultant
Building Discovery
Learn the Building
The project team assessed the existing conditions and systems of the Empire State Building. The team reviewed the following items:
- Operating schedule
- Building and energy management systems
- Cooling systems
- Heating systems
- Ventilation systems
- Lighting
- Plug loads
- Tenant IT loads
- Domestic hot water
- Envelop system
Here is a quick summary of the current building HVAC system:
- Offices and base building up to floor 79:
- Steam radiators supplied by district steam
- VAV chilled water AHUs
- Electric drive centrifugal chillers located in the cellar separately serving three pressure zones with a common condenser water system
- Steam chillers as backup only
- Retail:
- Water-cooled DX
- 80th floor and above:
- Multiple air-cooled chillers serving multiple systems including observatory
- Some self-contained air-cooled DX in some broadcast areas
Build the "Business-as-Usual" Base Case
Utility Analysis (Existing Condition) - The project team analyzed the building utility data for baseline year of 2019 to evaluate the breakdown of energy usage, utility costs and resulting carbon emissions by fuel source (i.e., gas, steam, and electricity – broadcast electricity usage was also broken out at the request of the owner). Electricity energy usage made up the majority of the energy consumption at 63.2%, while steam made up 35.1% of the energy used. While the energy cost profile is similar, the portion of electricity costs increases relative to the steam cost due to the tariff structures for the building. The results of the study are shown in the figure below:


Figure - 2019 Baseline Building Energy Consumption (LEFT), Energy Cost (MIDDLE) and Carbon Emissions (RIGHT) by Fuel Type
Building Performance Standard Impact Analysis - Important carbon-related project objectives were overlaid onto the base case to help the project team understand at a glance the scale of the reductions required. These included the LL97 emissions limits for 2024-2029, 2030-2035, and beyond 2035 as well as an 80% reduction from the 2007 baseline. Superimposing this information made it clear that while previous energy efficiency measures had significantly reduced emissions below the LL97 2024 limit, more work was needed to meet the remainder of the emissions limits and the 80% reduction target. Notably, achieving the 80% target would require more than just improving or even eliminating gas and steam usage, but also reducing the electrical usage.

Figure - 2017 &. 2019 Baseline Carbon Emissions Compared to Project Objectives
Identify Preliminary ECMs & Carbon Reduction Strategies
During the process, the team narrowed down over 200 energy and carbon conservation measures to 60 ECMs that have potential to be implemented over the next 15 years.
Energy & Carbon Modeling
Build and Calibrate the Initial Energy Model
The Empire State Building (ESB) energy model has been developed over the past 15 years. Each year, the energy model has been calibrated based on several factors including utility bills, hourly sub-metering, occupancy rates, new construction projects, etc.
Create the Baseline Energy Model
The baseline energy model for the Empire State Building was developed and is maintained by Quest Energy Group. In this latest version, the energy model was calibrated to the 2019 calendar year. The 2020 utility data was not used given the unique changes in occupancy and operation due to COVID-19. After the baseline model was calibrated, the eQUEST energy model outputs were then compared to the total monthly data from ConEdison. Calibration is maintained with statistical error and broken down by the various end uses in the building.
Generate Detailed End-Use Breakdowns - The results from the baseline energy model allowed the project team to analyze energy usage on a deeper level. The energy usage breakdown showed that space heating, broadcast, and tenant loads were the largest contributors to energy usage. This analysis allowed the team to determine where there were opportunities for improvement.
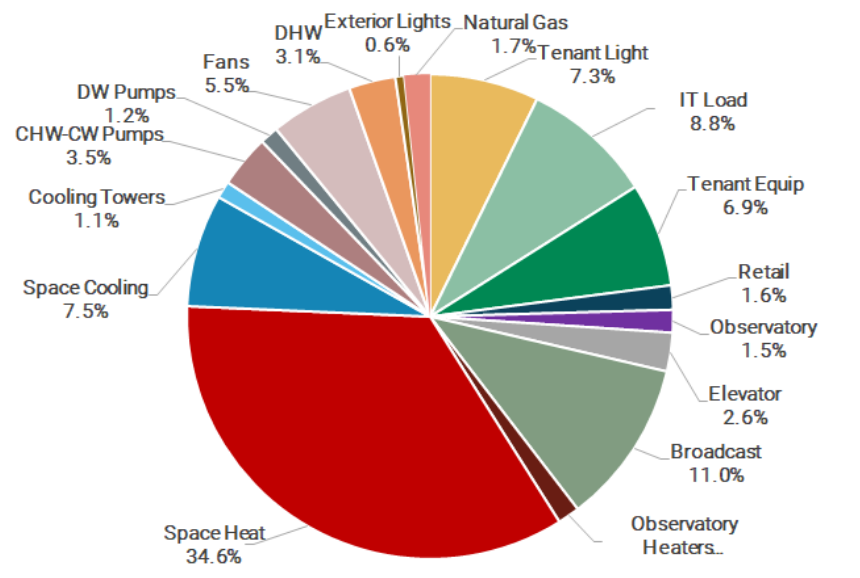
Figure - 2019 Baseline Energy Usage Load Breakdown by End-Use
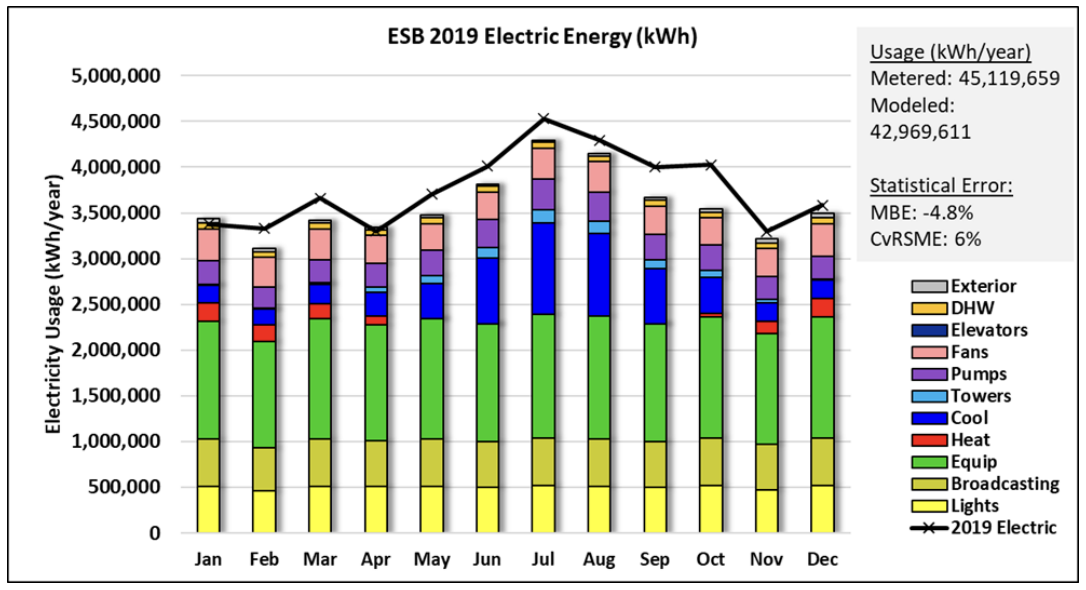
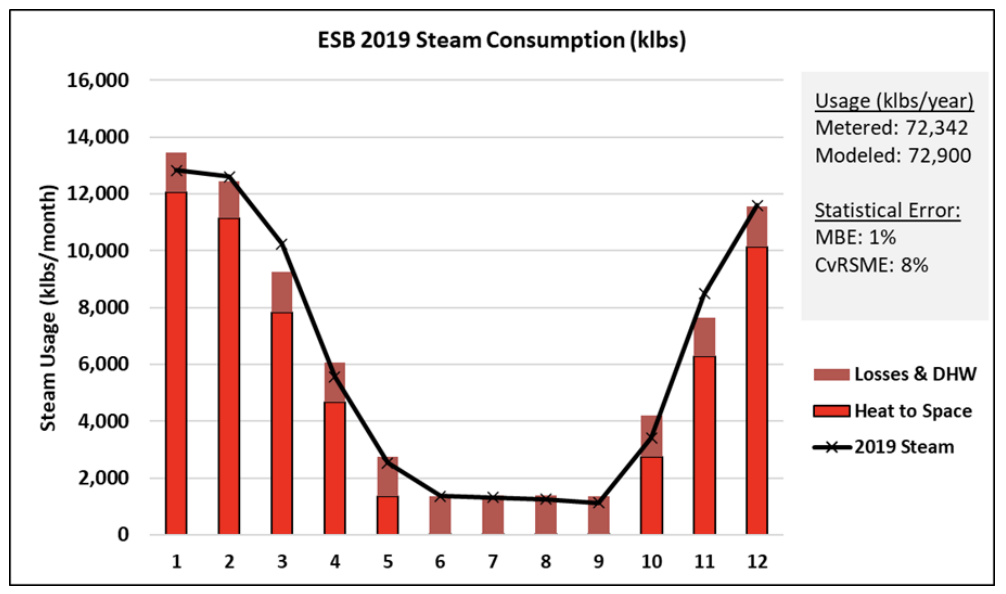
Figure - Baseline Model Electricity Usage (LEFT) and Steam Usage (RIGHT) Compared to Metered Data
Overlay Carbon Emissions - Carbon emissions were broken out by fuel source, system, and ownership to help the project team understand the primary contributors and identify areas for reduction. From this analysis it became apparent that while optimization of base building systems like the central plant and steam system could provide significant emissions reductions, the project targets could not be achieved without addressing the contribution of tenant systems and equipment. Indeed, tenant plug loads are a significant component of the building’s baseline carbon emissions, with office and retail tenants accounting for almost 31% of total 2019 carbon emissions.
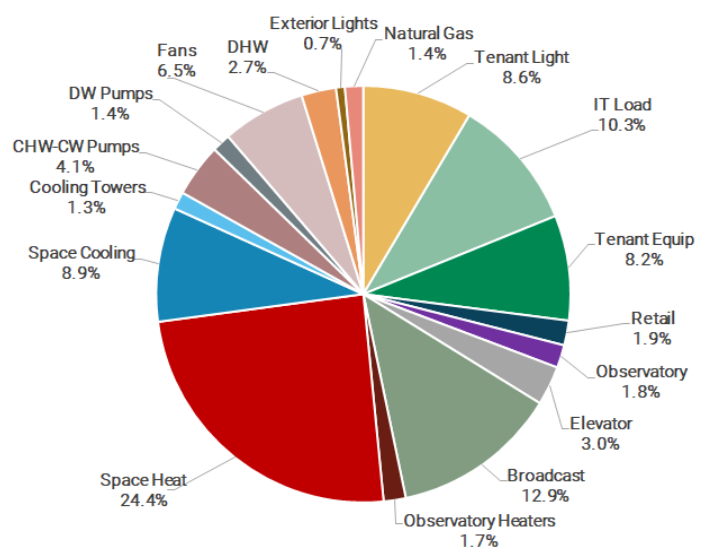

Figure - 2019 Baseline Carbon Emissions Breakdown by End-Use (LEFT) and by Ownership (RIGHT)
Base building energy usage and carbon emissions include:
- All district steam heating
- Central cooling plant equipment
- All office tenant AHUs
- Elevators
- Lobby HVAC unit
- Common area lighting and equipment
Analyze Individual ECMs
The team narrowed down over 200 energy and carbon conservation measures to 60 ECMs that have potential to be implemented over the next 15 years. Each ECM was vetted technically and identified as an opportunity to reduce energy consumption and further decarbonize the building. The energy modeler analyzed the ECMs through the baseline energy model to extract the associated energy, carbon and cost savings. As examples, below is a list of a few ECMs that the project team studied, with details on the energy modeling methodology used.
| ECM | Description | Summary of Energy Modeling Methodology |
|---|---|---|
| 1st Floor Lobby Air Distribution Optimization | The existing lobby air distribution system needs upgrading if we are to minimize the conflict between optimization (i.e., sequence of operation recommendations/upgrades to AHU to address stratification) and art preservation requirements. Existing system is not designed for true humidity control and the location of the original supply grilles doesn't lend itself to close control of the ceiling. The design would look to upgrade the AHUs, add reheat using a heat pump, and modify the supply grille locations and type to ensure the ceiling is protected whilst minimizing the over cooling at low level. Optimize according to CFD Report. 2 measures (active pressurization to control infiltration, and addition of space thermostats for active temperature control) are ECMs, others are artwork preservation. | First floor lobby AHU switched from steam heating to dedicated heat pump hydronic loop. Better control of relative humidity in the space. Cooling temperature setpoint adjustments based on control of RH and destratification. Better controls of infiltration into the building. Baseline Parameters:
Proposed Parameters:
|
| Airside Sequence of Operations | Align AHU sequences with ASHRAE Guideline 36-2018 with modifications to limit low CHW dT. Low dT syndrome mitigation measures: limit approach temperature between SA-T and CHWS-T (i.e. an AHU designed for 55 F air at 44 F water will not try to make 55 F air with 55 F water), high limit on AHU CHW valve position to maintain CHWR-T at AHU unless SA-T is well above setpoint. Add temporary unoccupied mode to VAV boxes based on lighting system occupancy data (allows box to flow no air when the temperature is ok and there are no people in the space). Allow perimeter heat without AHU operation. Add pulsed ventilation mode (time averaging per ASHRAE 62.1) where existing ventilation controls lack authority (can't reduce airflow to the required flow) due to missing OA fan VFD or stack effect. Corrected controls for MER unit heaters and duct heaters. AHU currently used for overnight heating in SOO, switch to perimeter heating for setback. Update existing VAV sequence:
| AHU average runtime adjusted from 12 hr/day to 10 hr/day. Discharge Air temperature setpoint high limit increase from 58F to 68F. Constant static pressure control changed to static pressure reset control on AHU fans. Avg static pressure of 0.8. Applied to floors 3 through 75, 80, and 84 Baseline Parameters:
Proposed Parameters:
|
| EXF Heat Reclaim | Constant volume Toilet exhaust, on the order of 140,000 CFM, currently existing the building without heat recovery. Retrofit: Add ERV to mechanical rooms for OA preheating (~1200 CFM/room avg) | Energy recovery ventilation system installed on each tenant floor. Effectiveness of 0.7. Added fan pressure of 0.25 in wc. on each side of the ERV. Applied to floors 3 through 75, 80, and 84. Electric unit heater in mechanical room removed. Baseline Parameters:
Proposed Parameters:
|
| Window U-value | Window Center of Glass Upgrades: Window Frame Upgrades: Audit and intervention: Thermal breaks/gasketing of window, air sealing Products:
| Upgraded ALL 6000+ windows from current specs to Winsert proposed specs. Reduced infiltration through the window by half. Baseline Parameters:
Proposed Parameters:
|
| Steam Phase-Out with Hot Water Riser | Long-term solution for phase-out of steam heating: Centralized air-water heat pumps (~1000 tons) generate HHW which is distributed to tenant floors through a hot water riser. HHW is used at AHU coils. Decarbonization of the perimeter steam system is captured under SS010. | Switch AHU heat source from steam to hot water HP loop and adjust AHU controls to be primary source of heating (perimeter system secondary source) Baseline Parameters:
Proposed Parameters:
|
Group, Sequence, and Package ECMs
Related ECMs were grouped together into phases and sequenced in the modeling order such that savings for each ECM build on the last. These phases were then sequenced based on the logic of improving and optimizing existing systems first, then reducing loads, and finally replacing or updating the equipment. The sequence was also based on feasibility and expense, such that the phases that involved large system interventions like geothermal, DHW electrification, colocation of IT equipment, and chiller replacements are sequenced towards the end of the study period (phases 6-10). The team also developed a proposed implementation timeline for each of the phases. For example, the controls optimization measures in Phase 1 were proposed to be implemented immediately and completed in 1 year, while the Phase 5 ECMs that are intended to be implemented at tenant lease renewal extend over a period of 10 years.

Figure - ECM Phasing and Implementation Timeline
The ECMs were also grouped into 5 distinct packages which contain different combinations of ECMs, and an increasing number of them, in order to study their impact on CO2 reductions and Net Present Value (NPV). This allowed the team to review how different combinations of ECMs measure up against the project objectives.
The NPV Max package contains the least amount of ECMs which are all NPV positive. On the opposite end of the scale, the CO2 Max package includes all the ECMs that were studied. Three additional packages were created to result in cost and carbon reductions in the middle of the scale. These were the CO2 Light, CO2 Mid, and CO2 High packages, which generally include all the measures that the project team recommends implementing with the major difference between them being that CO2 Light explores just optimizing the existing steam system, whereas CO2 Mid explores partial HVAC electrification, and CO2 High includes complete HVAC electrification plus a few other tenant measures.

Figure - Relationship between Carbon Reductions and Net Present Value in ECM Packages
Generate a Decarbonization Roadmap
Now that the finalized ECMs have been grouped, sequenced, and packaged, the energy model can be run for each ECM package to obtain energy and carbon impacts. The project team compared the results of this analysis and calculated the energy and carbon savings from the baseline model. The results of this analysis are shown in the figures below. These results will be used in the detailed financial analysis and will represent a time-dependent decarbonization roadmap for the building.

Figure - ECM Package Energy Savings Comparison
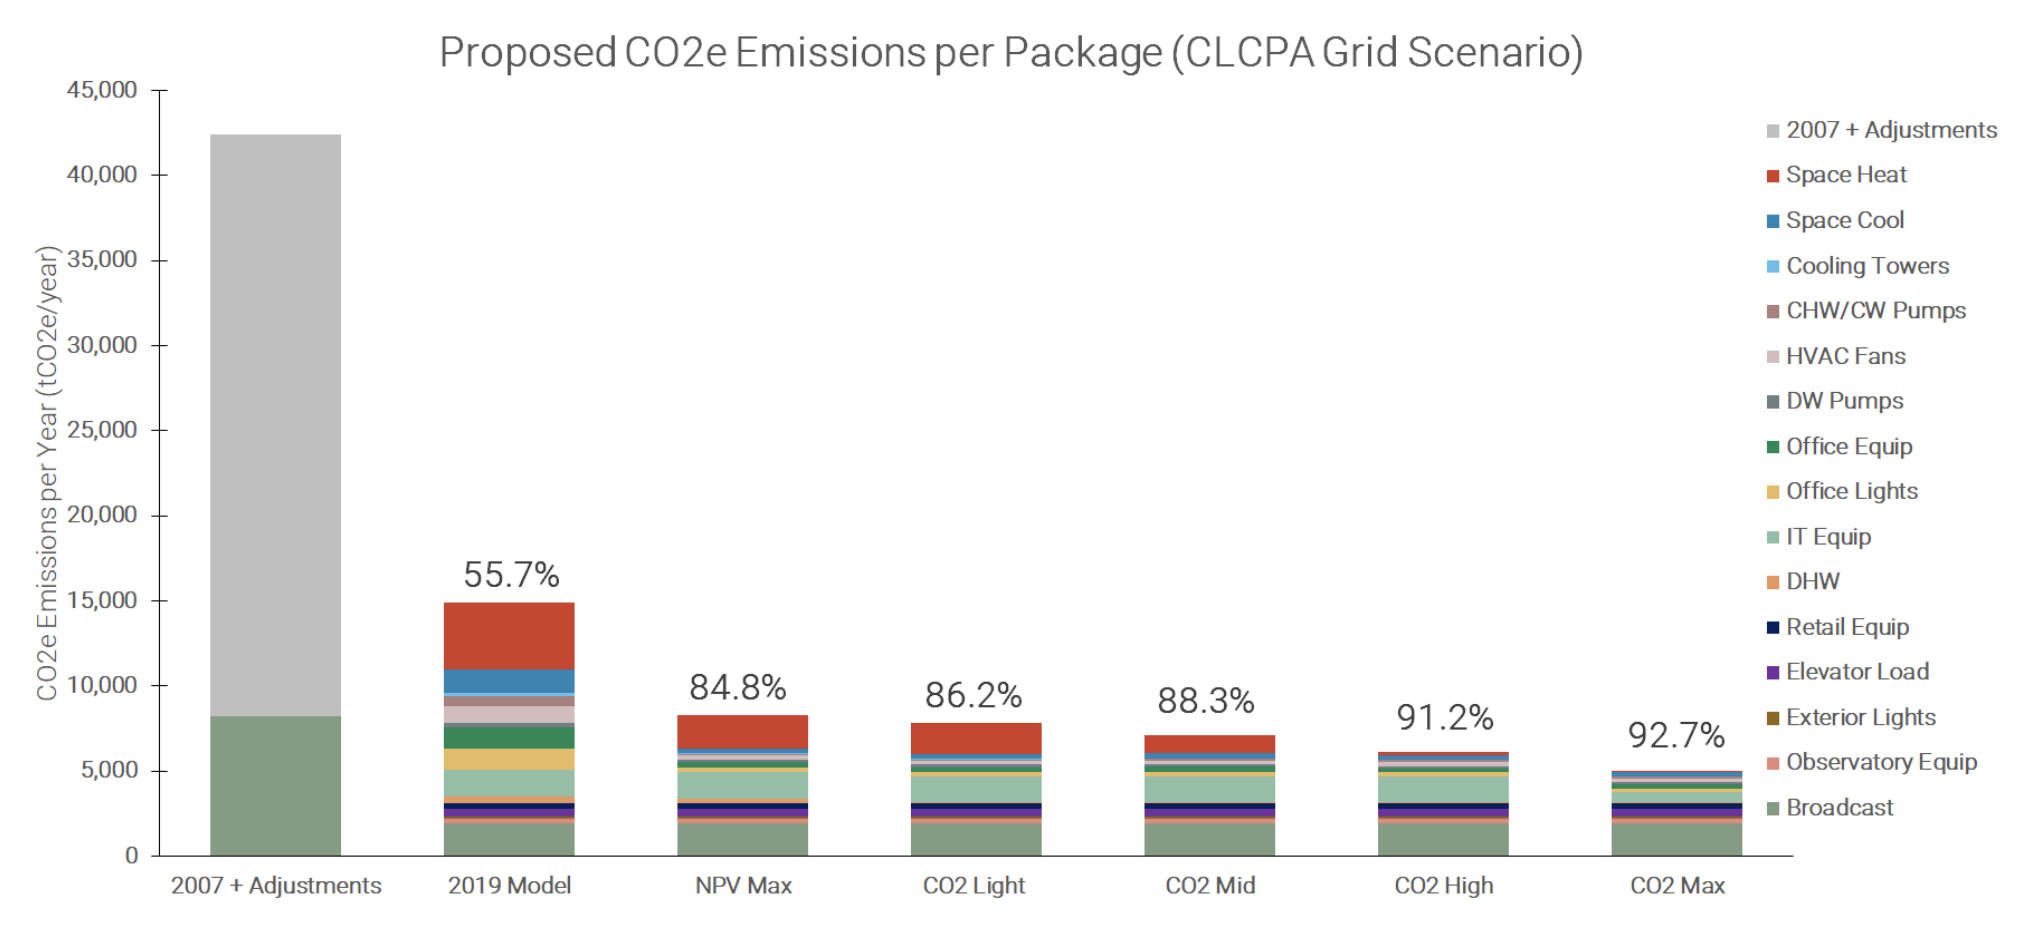
Figure - ECM Package Carbon Savings Comparison
")
Figure - ECM Package CO2 Emissions Projections Comparison Over Time (CLCPA Target Grid Scenario)
While energy modeling was completed for all 5 packages of ECMs studied, the figures below focus on summarizing the results for the CO2 Mid Reduction Package which forms the Decarbonization Roadmap for the Empire State Building. The CO2 Mid Reduction Package provides the optimal techno-economic balance and is currently slated for implementation. However, certain ECMs in the CO2 High Reduction Package are recommended for further study to better assess their constructability, cost, and performance, and may be considered for implementation in the long term based on the outcomes of the planned pilots. Both packages meet ESRT’s goal of 80% carbon reductions compared to the 2007 benchmark year by 2030, as well as the average-long term Local Law 97 (LL97) limit by 2035.
At the end of the 15-year study period, it is expected that the CO2 Mid Reduction Package will reduce energy consumption by 64.8% compared to the 2007 baseline (see Figure below). Phases 1, 2, and 5 (including steam phase out which is broken out separately) result in the largest energy reductions for this package with energy savings contributions of 6.1%, 8.0%, and 5.7% respectively.

Figure - CO2 Mid Package Energy Reduction by Phase
The Figure below shows the breakdown of the carbon reduction anticipated by phase for the CO2 Mid Reduction Package. The total carbon savings anticipated are 65% from the 2007 baseline, assuming the 2019 carbon coefficient. However, if the electrical grid continues to decarbonize in alignment with the CLCPA targets, the carbon savings can reach as much as 87% reduction from the 2007 baseline.

Figure - CO2 Mid Package Carbon Emissions Reduction by Phase
Economic & Financial Analysis
Obtain Pricing and Run the Analysis
Energy Cost Savings for all ECMs - A key part of the financial analysis was determining the energy cost savings of each of the ECMs. This is directly informed by the energy savings outputs from the energy model, as well as the advanced tariff analysis conducted by Luthin. As shown in the graph below, the measures with the highest energy cost savings are some of the more technically ambitious measures including steam phase-out, some of the envelope improvement measures, and the airside sequence optimization which eliminates a majority of the existing simultaneous heating and cooling. A key finding was that electrification does result in energy cost savings, even those the fuel source is being changed from steam to electricity. This is due to a strategy of implementing ECMs that reduce the heating load first, and then transitioning to electric heat pumps which produce more heat output per unit of energy input than electric resistance and fuel sources. Therefore, the increase in electrical cost is more than offset by the elimination of steam costs.
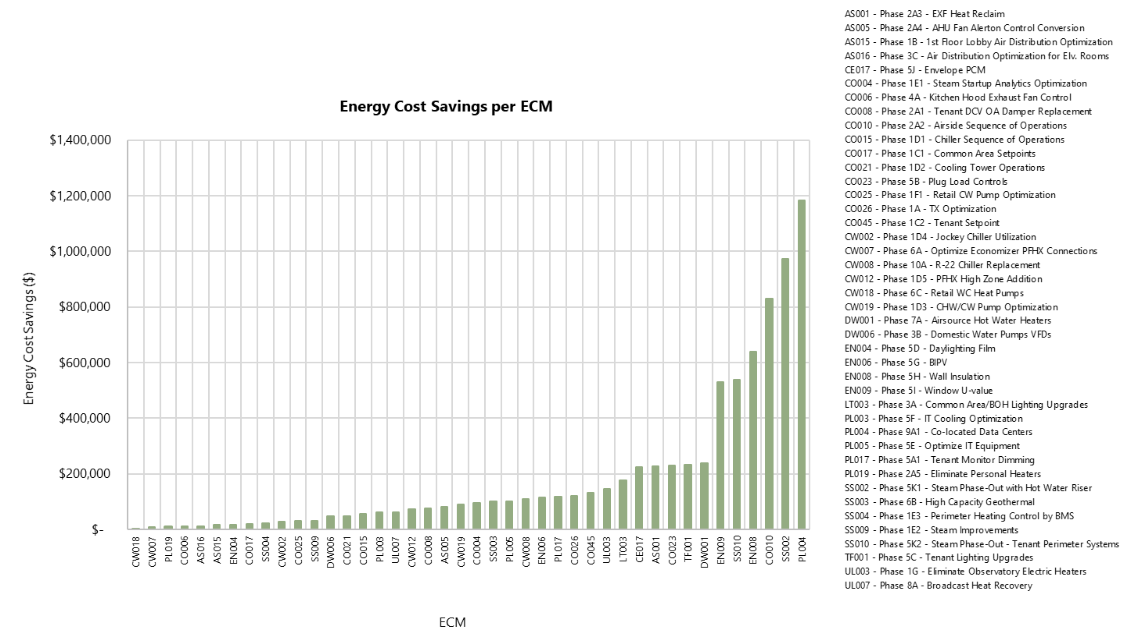
Figure - Energy Cost Savings per ECM
NPV for all ECMs - Individual NPV results for all ECMs are beneficial for the quick assessment and comparison between ECMs. The net present value of all the ECMs were calculated and used to inform the packaging of ECMs, which was an iterative process. The steam phase-out measures and envelope improvement measures were found to be the most NPV negative ECMs. Although these measures had some of the highest energy cost savings, the savings were overwhelmed by the high capital costs. For these measures the team also considered the impact on carbon reduction, simple payback, useful life of the system, and cost per ton of CO2 saved to provide a wholistic evaluation of the ECM performance.
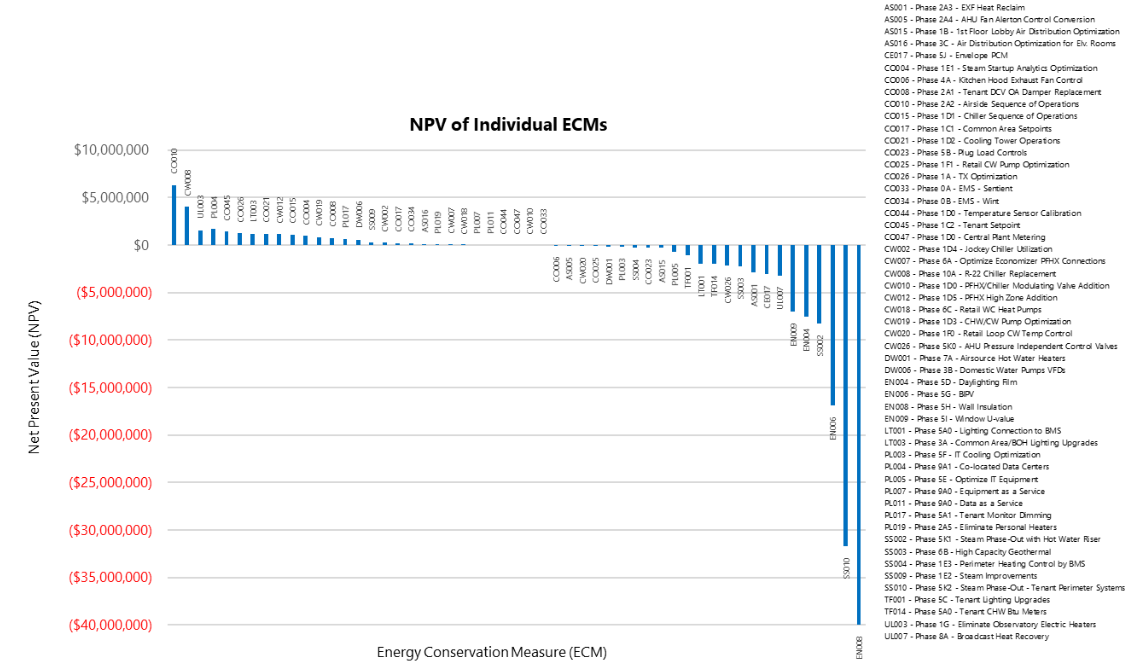
Figure - Net Present Value per ECM
Energy Cost Savings of ECM Packages - The energy cost savings for each package are summarized in the graph below. As expected, after 2023 the annual energy cost savings for each package increase from the less intensive NPV Max package to the most intensive CO2 Max package, correlated with the ambition of each package. By the end of the study period, the annual energy cost savings associated with the CO2 Max package are significantly higher as compared to the remainder of the packages.

Figure - Projected Annual Energy Cost Savings for All Packages
Capital Costs of ECM Packages - Cost estimates were also completed for each ECM and package studied. The total capital costs (including and excluding escalation) for all packages are summarized in the table below. The total estimated capital costs associated with the CO2 Mid Reduction Package are $40,672,466 excluding escalation, and $51,628,387 including escalation.
")
Table - Total Capital Cost for All Packages (Including & Excluding Escalation)
Graphed over time, the annual capital costs for the CO2 Mid Reduction Package are expected to remain below $10M throughout the study period. The graph below shows the anticipated annual capital costs for each package, including escalation costs. These annual capital cost expenditures align with the implementation timeline designated for each ECM and shown in Table 3. Of note, the CO2 High Reduction Package has more than double the annual capital costs of CO2 Mid Reduction after 2021.
")
Figure - Annual Capital Costs for Each Package (Including Construction Escalation)
Refine Projections and Make Recommendations
Using the Strategic Decarbonization Assessment (SDA) tool, the project team calculated the carbon emissions per year for three ECM packages compared to "business-as-usual" case.

Figure - Carbon Emissions Per Year by Scenario
The final financial results for each of the packages is illustrated in the NPV vs. CO2 Reduction figure below. The graph shows that three of the packages were NPV positive and 2 of the packages were NPV negative, but four out of five of the packages had a simple payback within the study period. The recommended package, CO2 Mid Reduction, has a positive NPV of $4,349,957 and a simple payback of 6.8 years. Implementing this package will require $40,672,466 (excluding escalation) of capital expenditure, and result in annual energy cost savings of $3,701,538 and operational savings of $546,000. This analysis accounted for $11,795,328 of available incentives from both Con Edison (Custom Commercial Electricity Program and Clean Heat Program) and NYSERDA, which makes up approximately 29% of the required expenditure. The major financial metrics for all the packages studied are summarized in the table below.
")
Figure - NPV vs. CO2 Reduction over 15 Year Period for All Packages (CLCPA Grid Scenario)

Figure - Summary of Financial Analysis Results for all ECM Packages